See where the time goes.
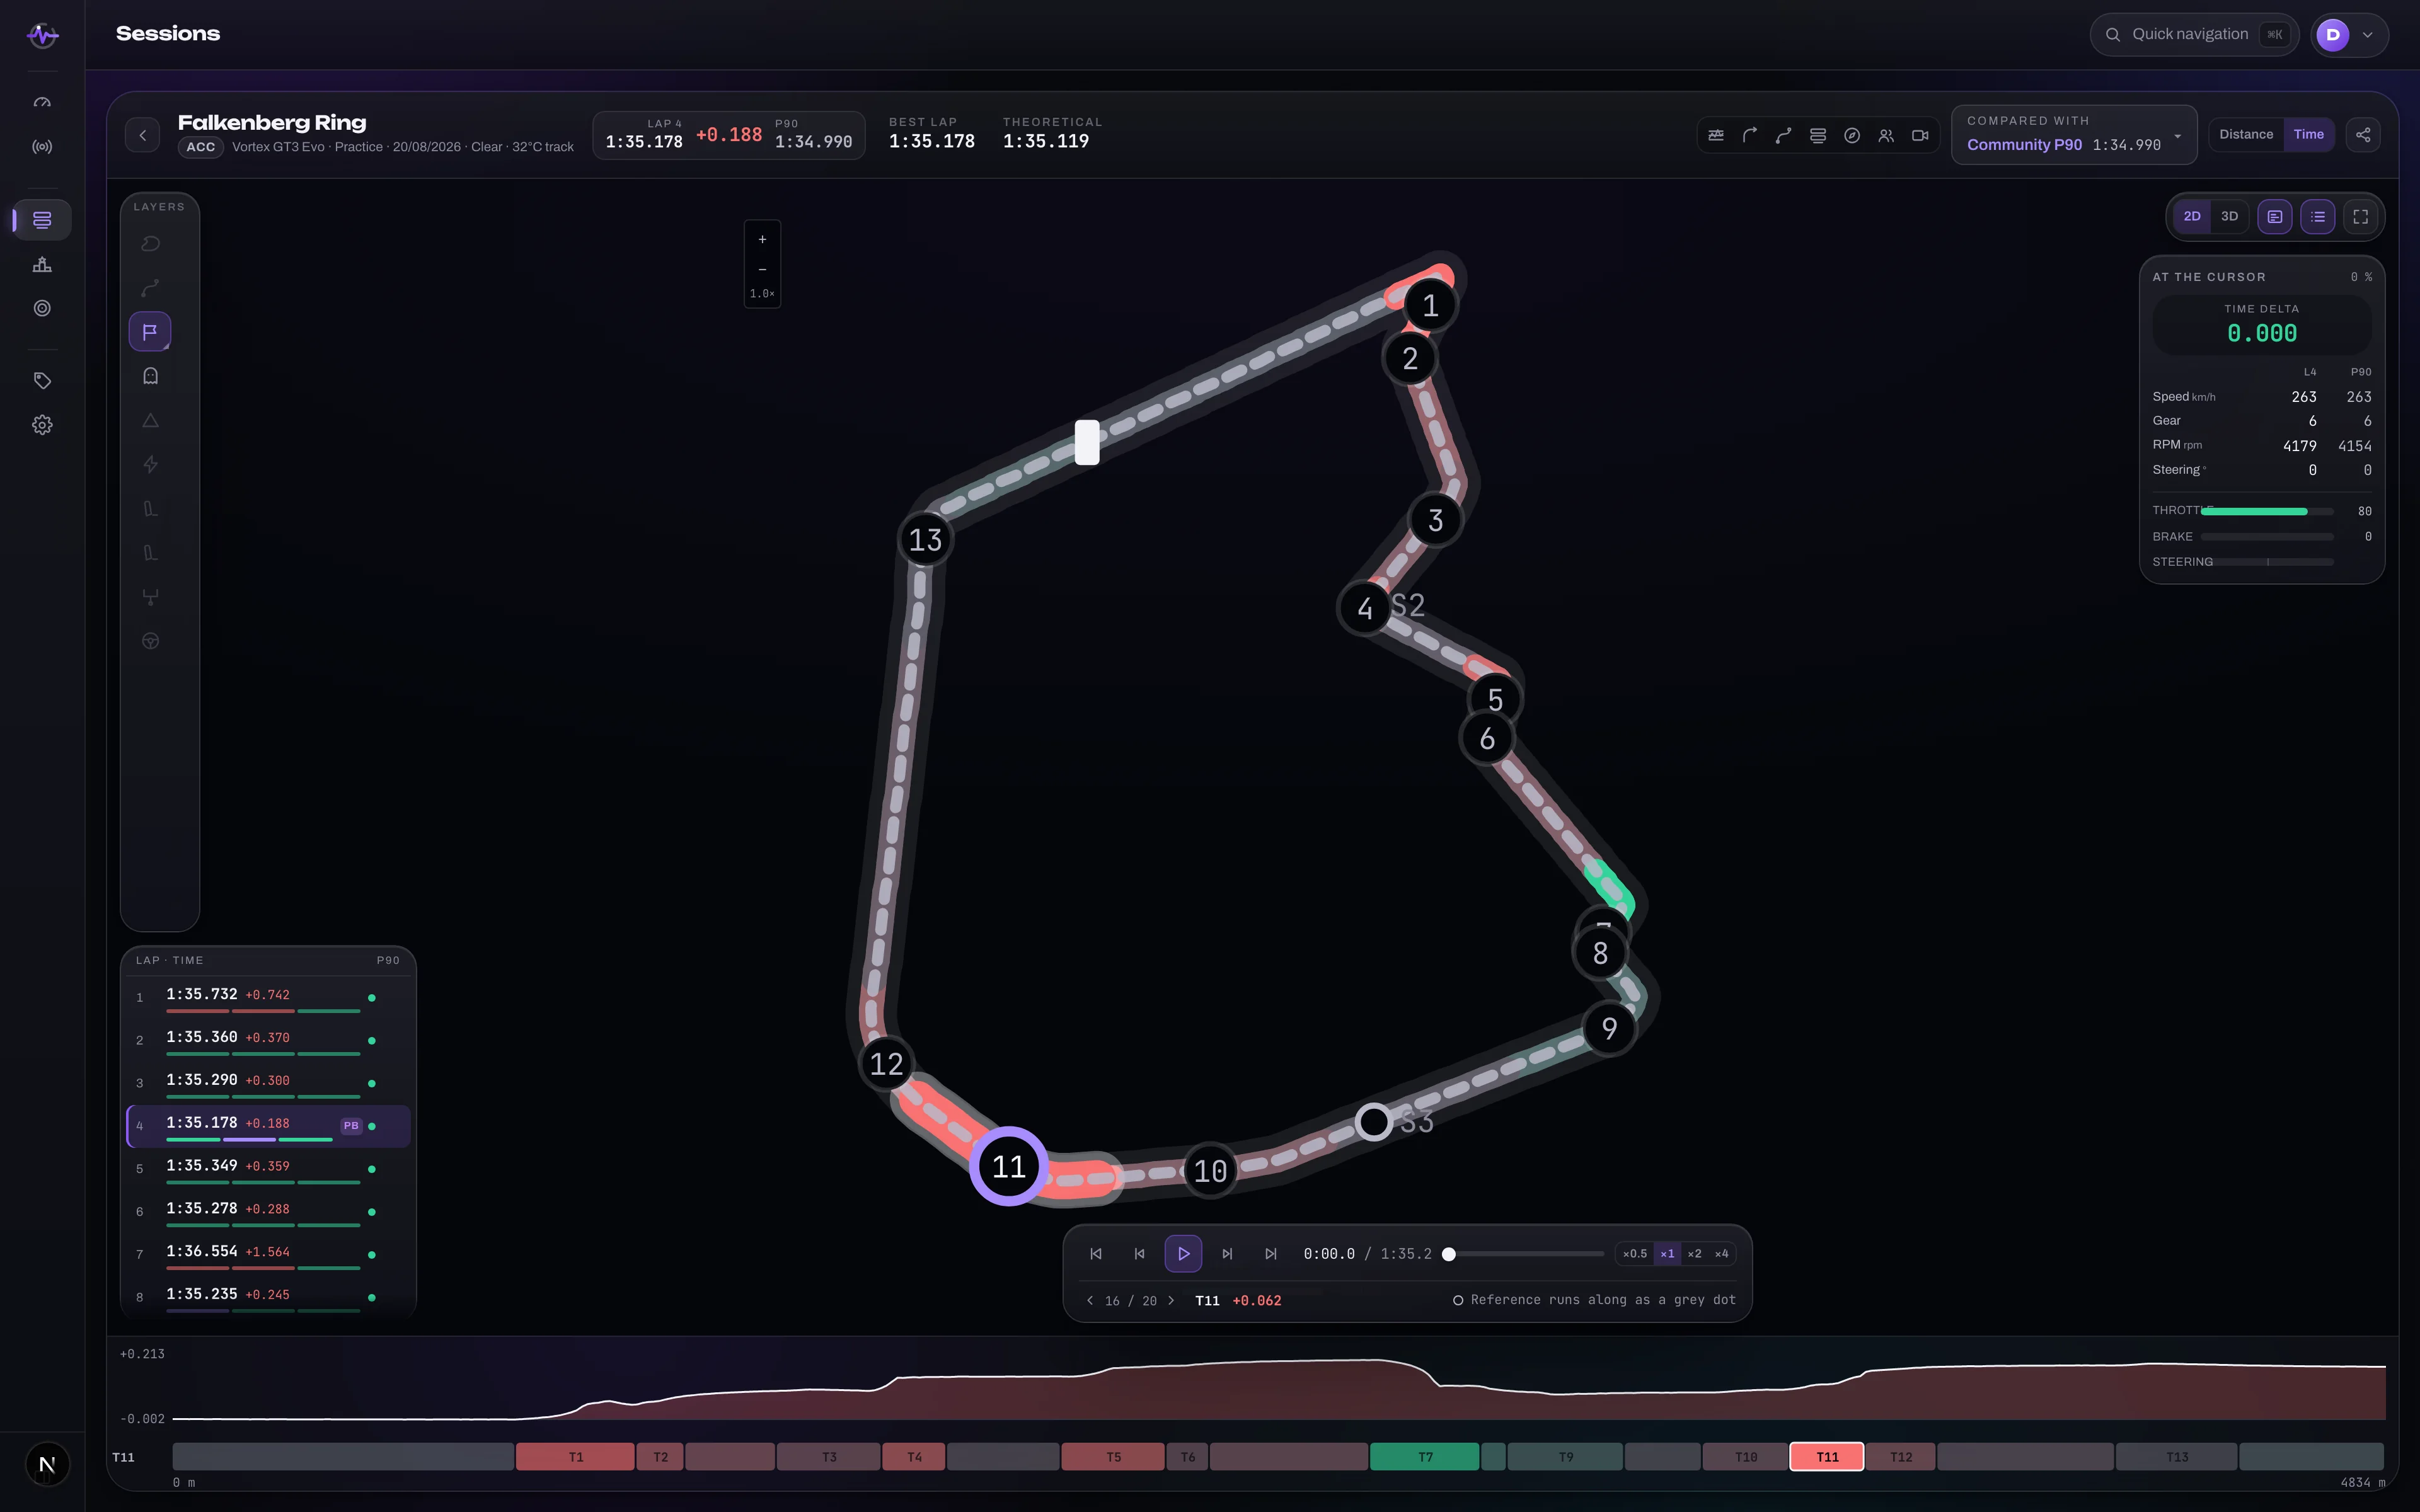
A lap is not a number, it is four thousand metres of decisions. The workspace lays them all out side by side: the track, coloured to show where it costs you — the channels below it, which say why — and the corner, where the two come together.
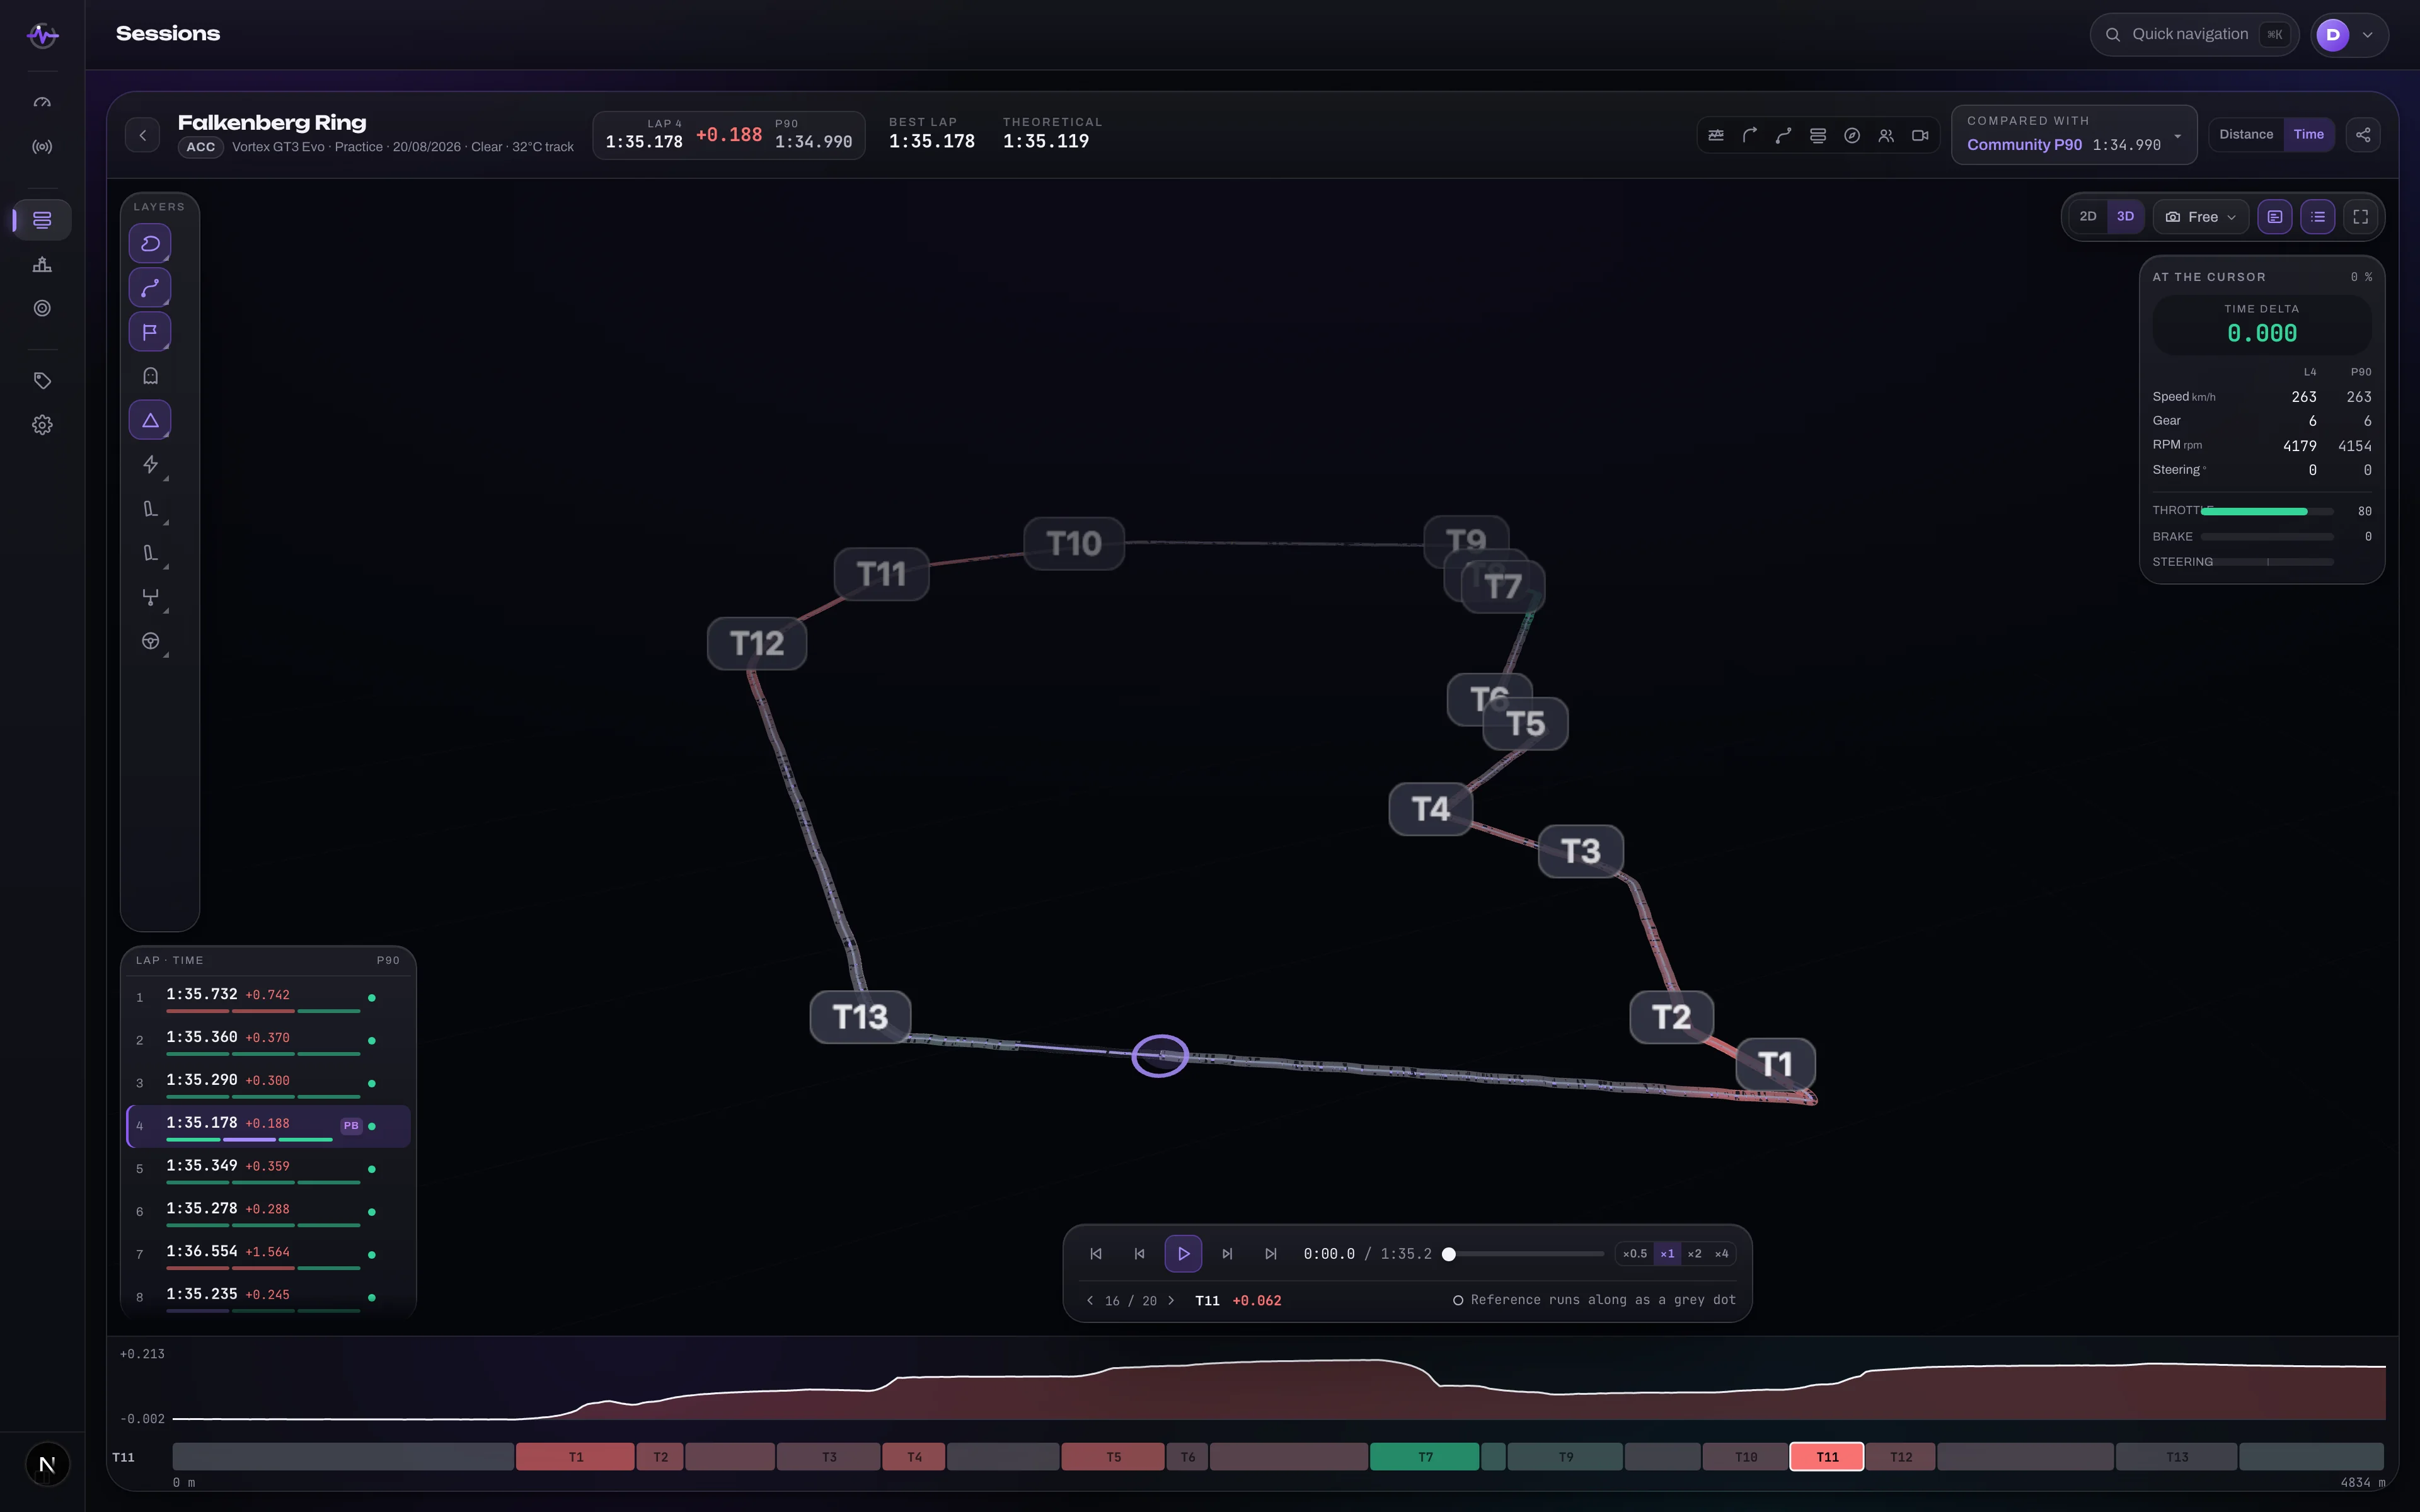
Assetto Corsa Competizione · GT3 · against the community P90 · demo telemetry
No tabs. Layers.
It used to be three screens called Overview, Analysis and Coach, and you lost the thread at every switch. Today the track always stays. Everything else goes on top of it as a layer, next to it as a sheet or under it as a drawer — and can be switched off when it gets in the way.
Layer rail
All 10 layers sit on the left. One click switches a layer on, a second opens its settings — width, opacity, colouring. Whatever this lap cannot supply is greyed out and says why.
Drawer
The charts are at the bottom, draggable to three heights: channel stack, corner workbench or line comparison. Wide things belong down there, not in a narrow column.
Tool sheet
The long and wordy things are on the right: session, coach, comparison laps, onboard video. Lists need height, charts need width — hence two places instead of one.
Playback
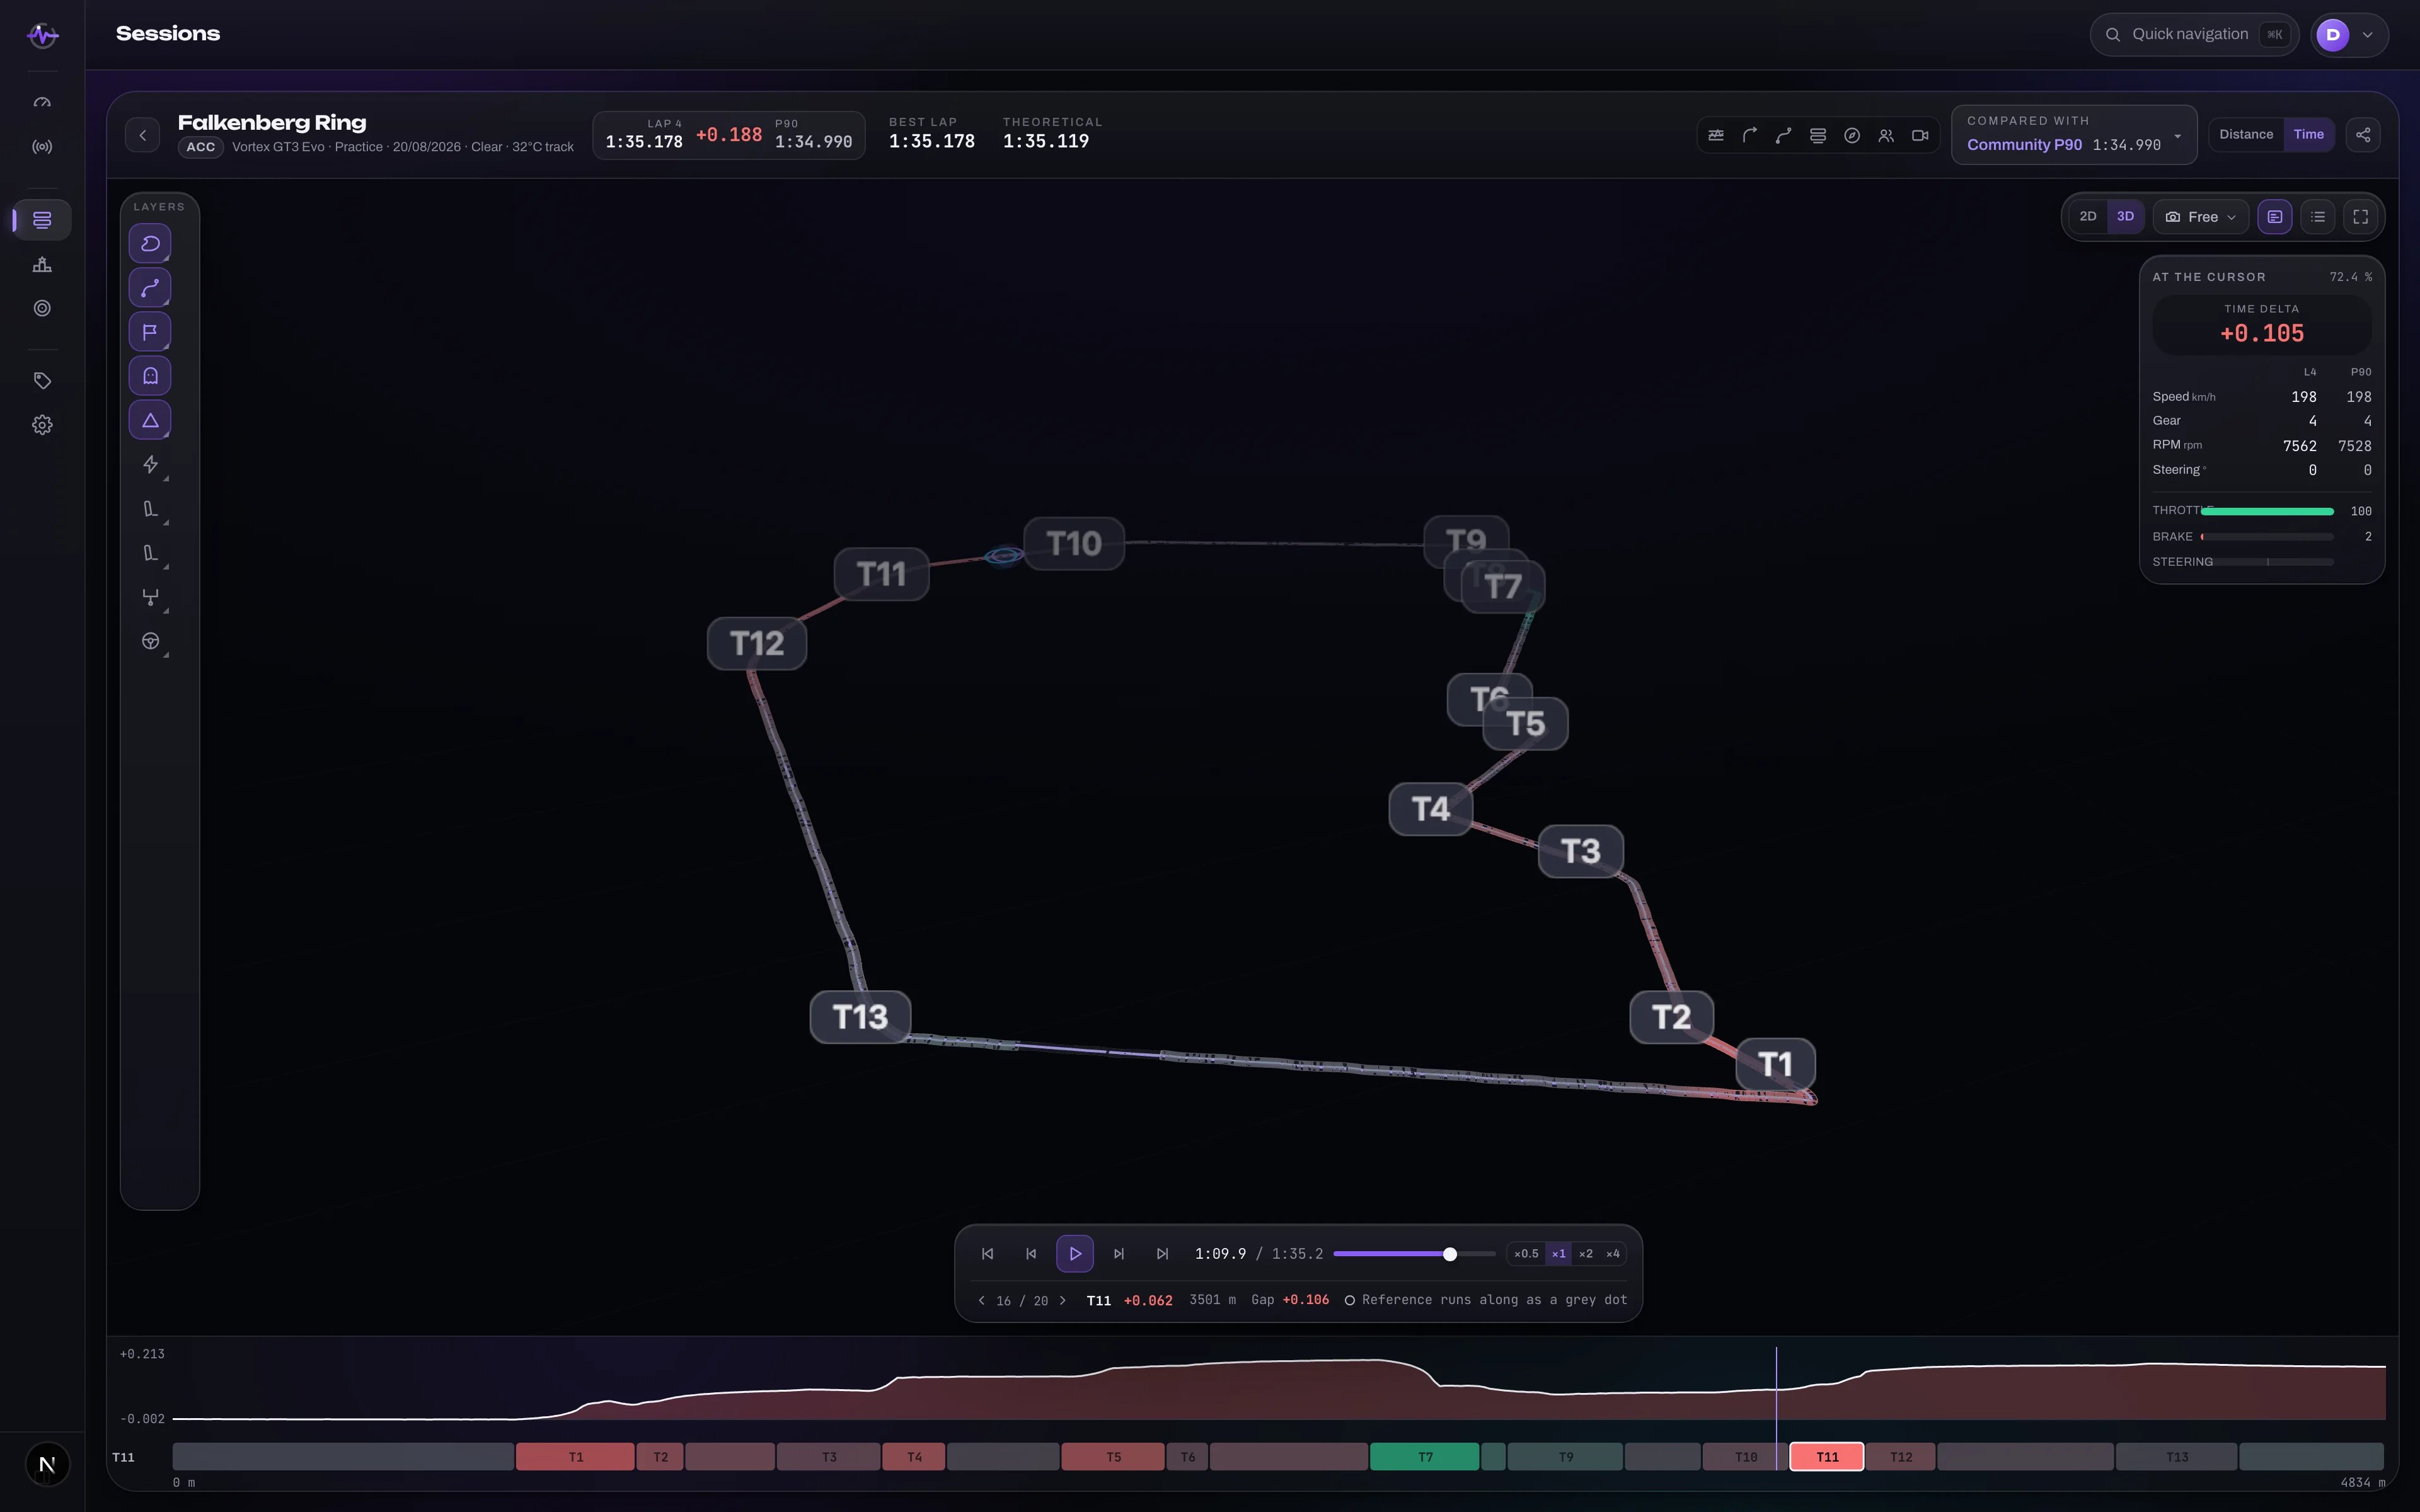
The lap as a film, from half to quadruple speed, single steps and a jump from segment to segment. The ghost runs its own time — the gap you see IS the advantage.
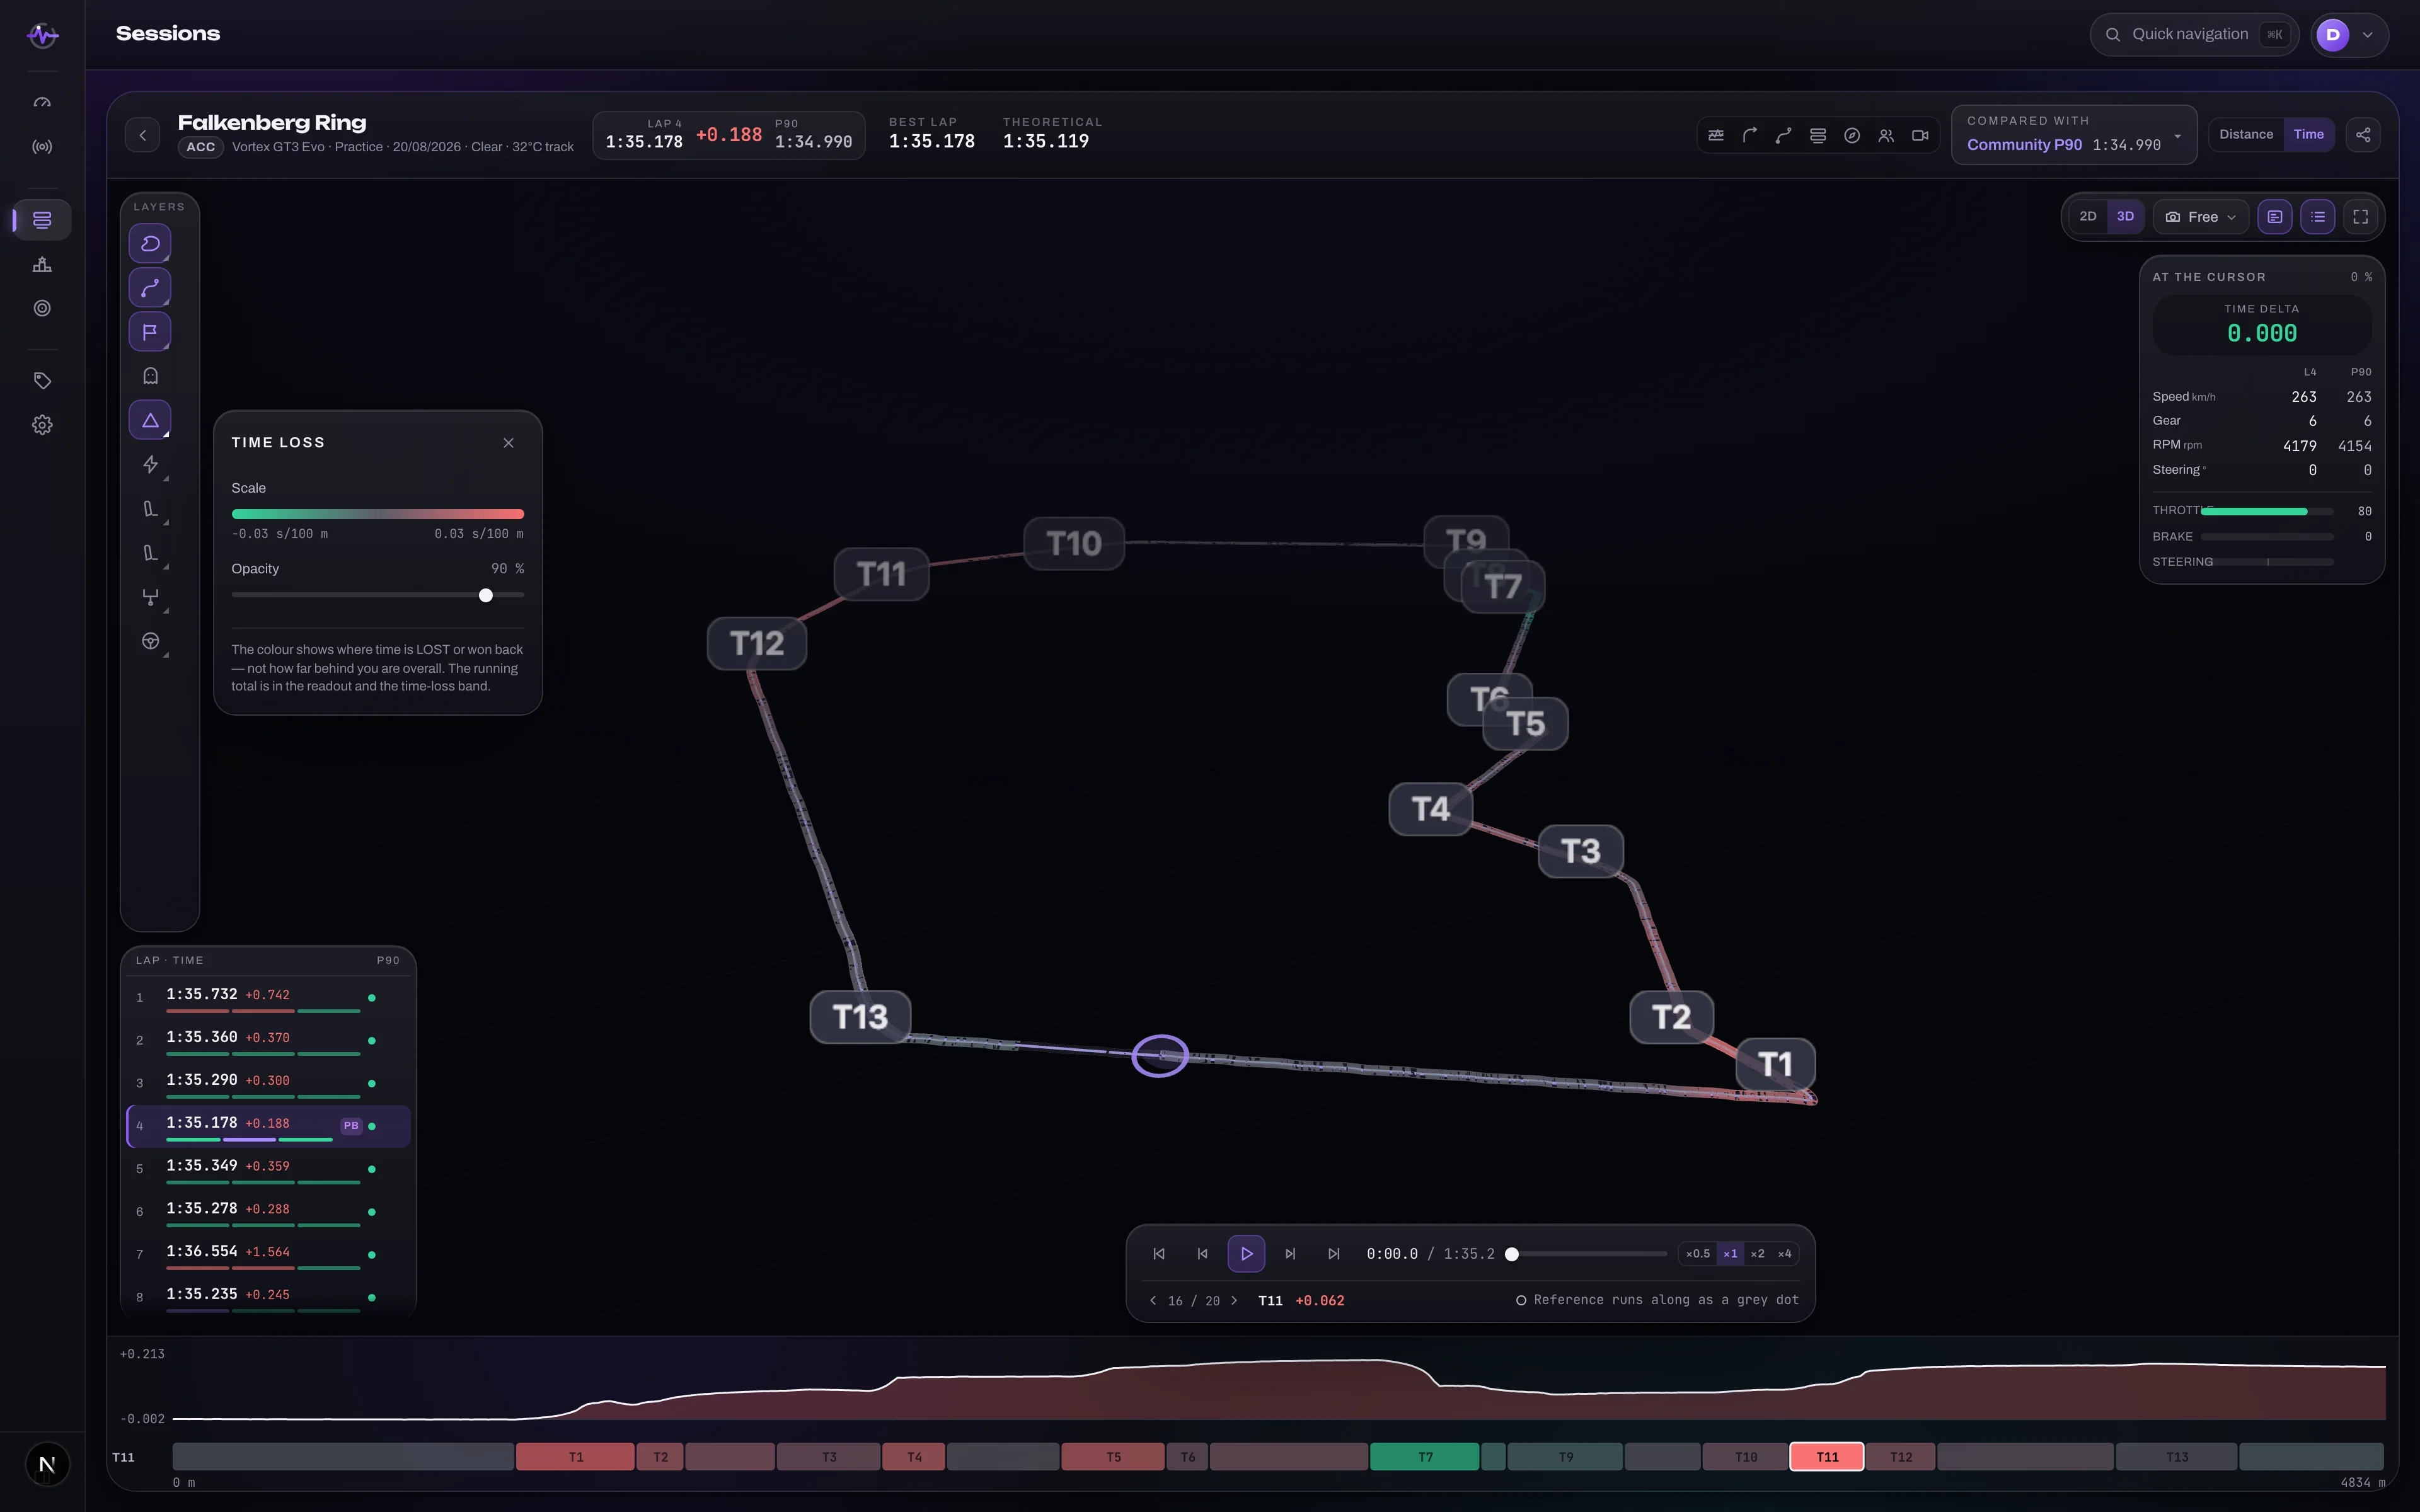
Your browser remembers layers, camera position and drawer height, kept apart per track. They are not held on the server: this is a workspace, not a record — which is why on another machine you start from the default again.
Spatial, not decorative.
The map is built from your first clean lap and is shared for that game from then on. On it sit your racing line, the reference line, kerbs, sector gates and the corner numbers. 6 cameras — Follow, Chase, Orbit, Trackside, Top down, Free. A double-click on a corner flies there and selects it everywhere at once.
Flat, and we say so here
None of the supported telemetry sources delivers an elevation profile. The track is therefore drawn level: Eau Rouge does not climb here. What you see is the layout with real width wherever the game reports the track edges — otherwise twelve metres as an assumption.
The ghost runs on time
Synced by distance he would sit next to you permanently and be pointless as a comparison. Synced by time he pulls away or drops back — and that is exactly the information. For braking-point and line work you can switch to distance in one move.
A corner means the corner
Braking start, turn-in, apex and exit are measured places, not painted markers. Select a corner on the track and the balance strip selects it too, and the drawer shows the same corner. There is no second selection state.
6 layers, six questions.
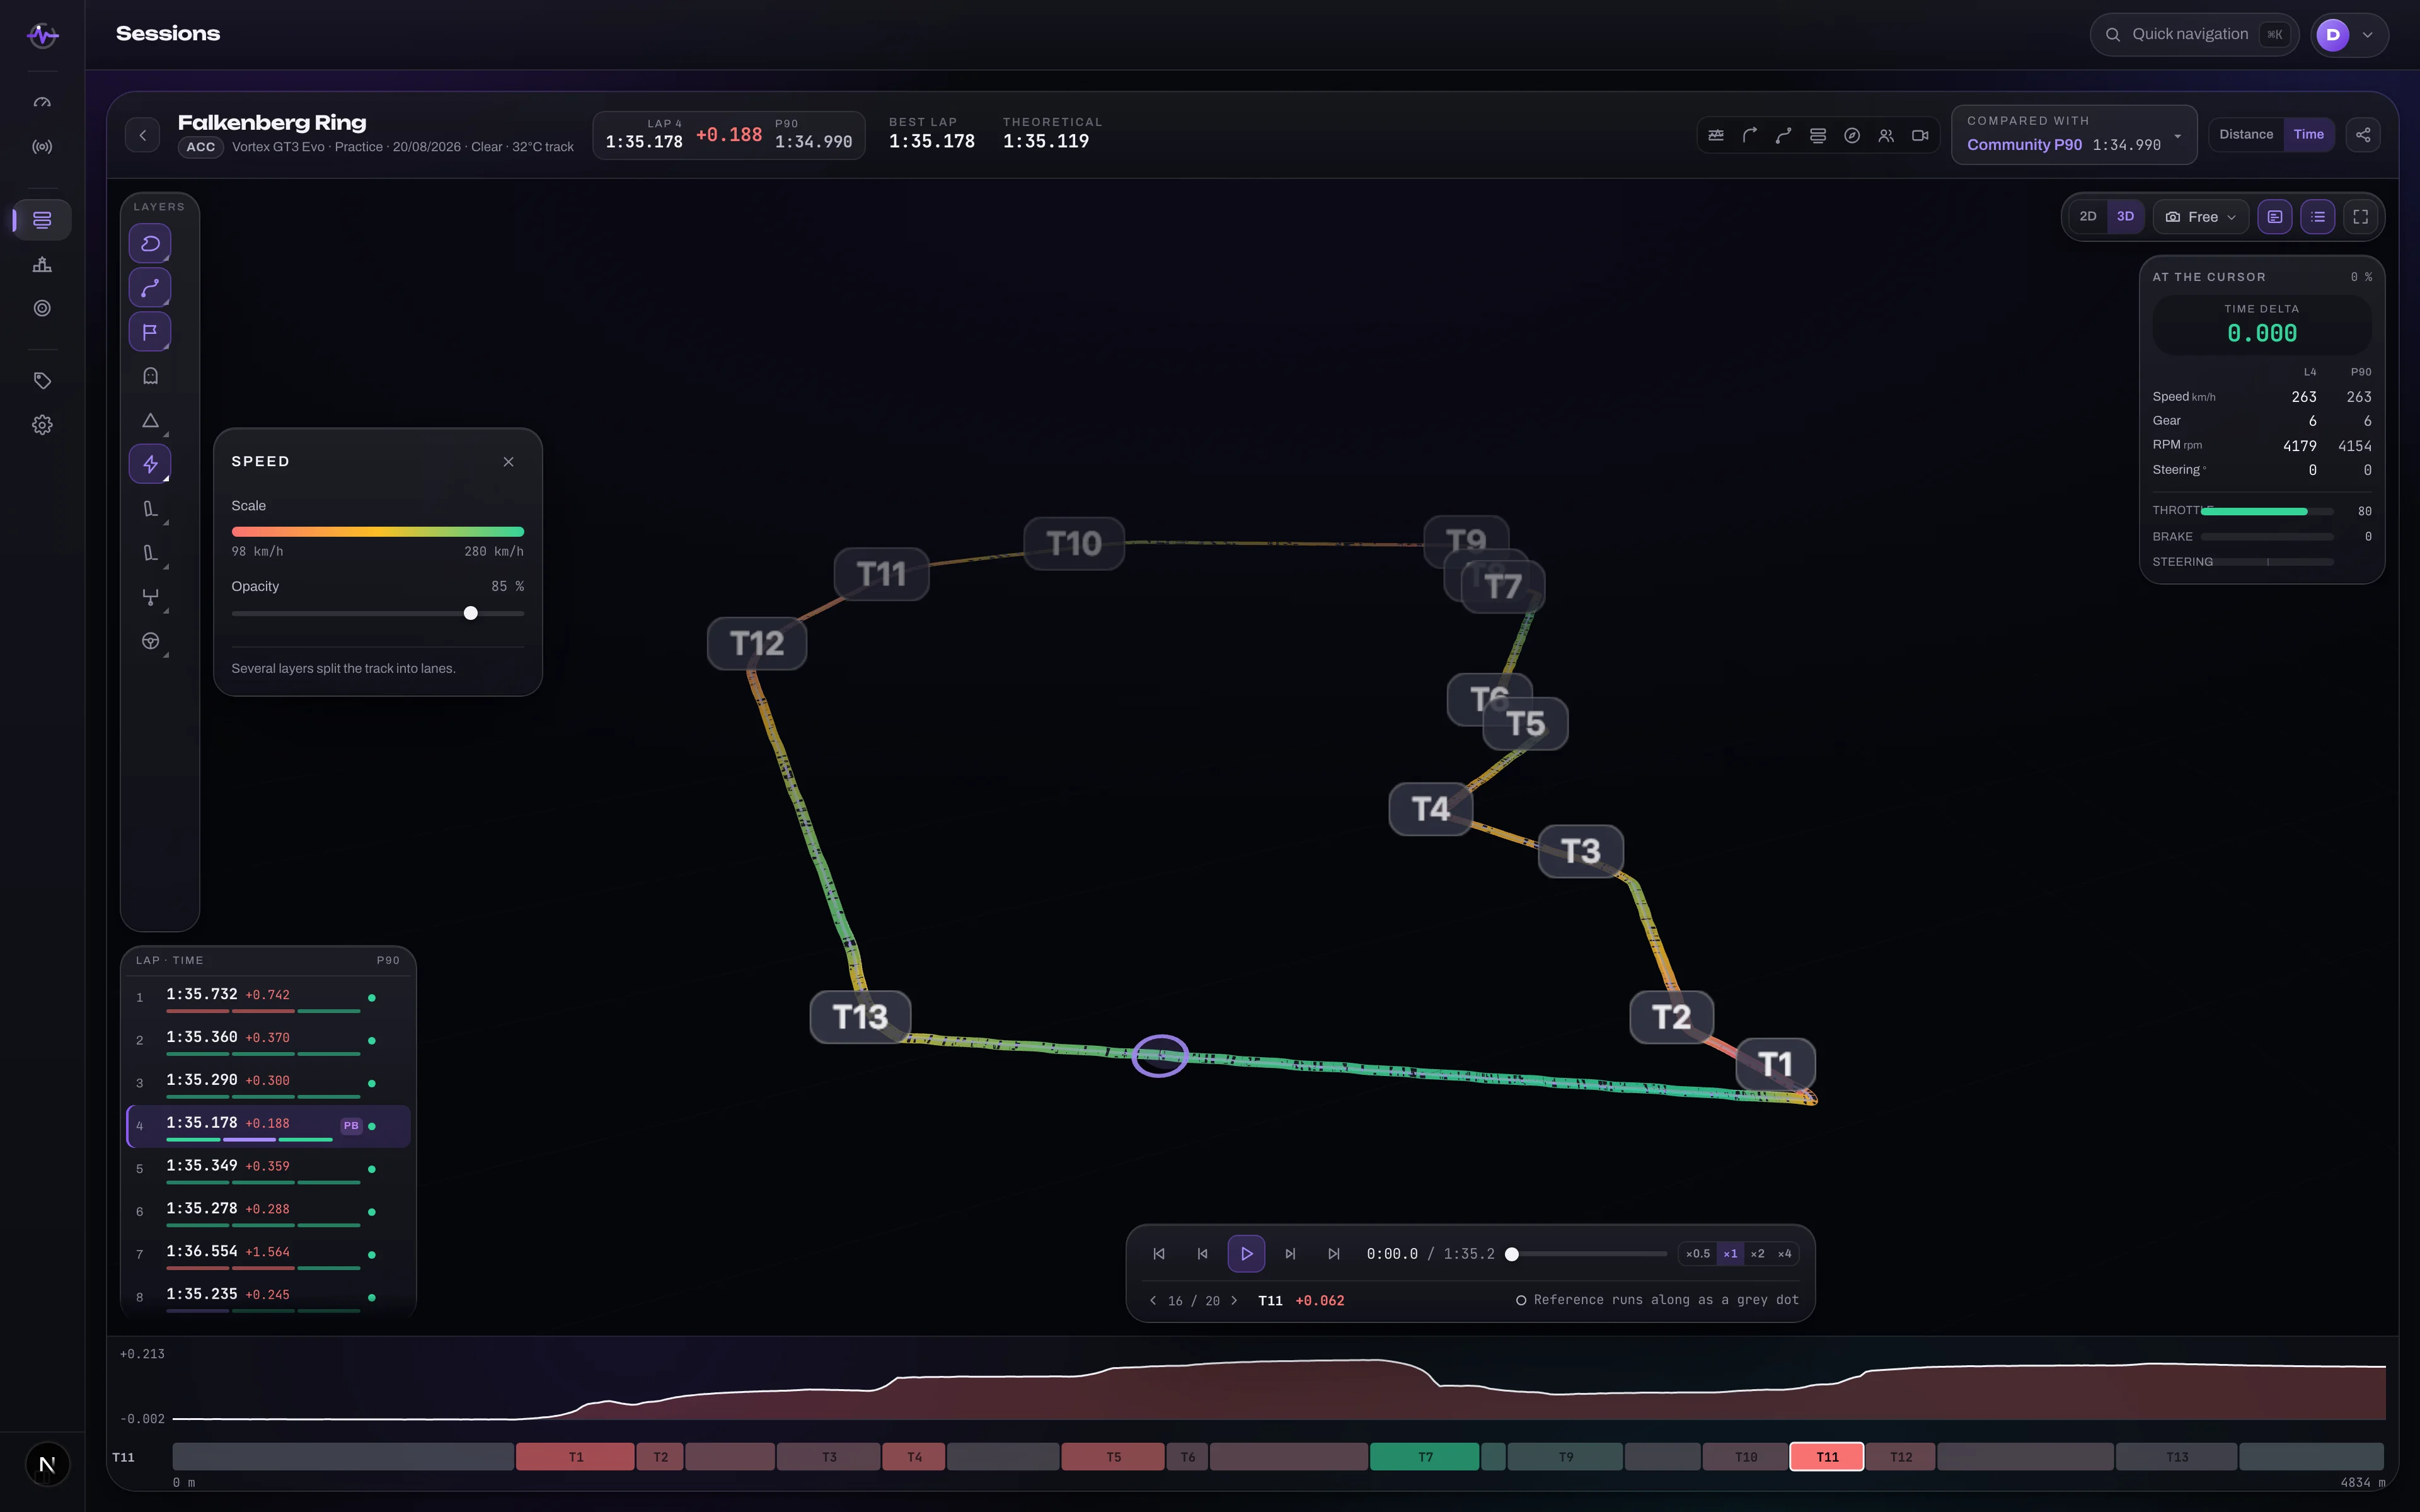
Every layer answers a different question at the same place. They can be stacked, dialled in opacity and switched off one by one — and the racing line itself can be coloured by any channel the lap carries instead of a solid colour.
| Layer | What it shows |
|---|---|
| Time loss | Where time is lost — not how far behind you are overall. Red means: the clock is running away from you here. |
| Speed | Speed across the whole lap, from the slowest to the fastest place in this lap. |
| Throttle | Throttle position, fixed scale from 0 to 100 %. |
| Brake | Brake pressure, fixed scale from 0 to 100 % — which makes braking zones comparable between laps. |
| Gear | The gear you are in, as a step and not as a curve. |
| Steering | Steering angle as a magnitude — corrections stand out as spikes. |
Honest about the scale: apart from throttle and brake, every colour scale is computed from THIS lap — from its robust percentiles. Two laps with the same colour in the same place are therefore not necessarily equally fast. If you want absolute values, read them off in the readout.
And when it has to be quick: 2D
The same map seen from above, with numbered corners, sector boundaries and a synchronised cursor. It costs no 3D acceleration, loads instantly and is the better answer on a weak machine. The colour layers are not there — the 2D map has its own mode switch.
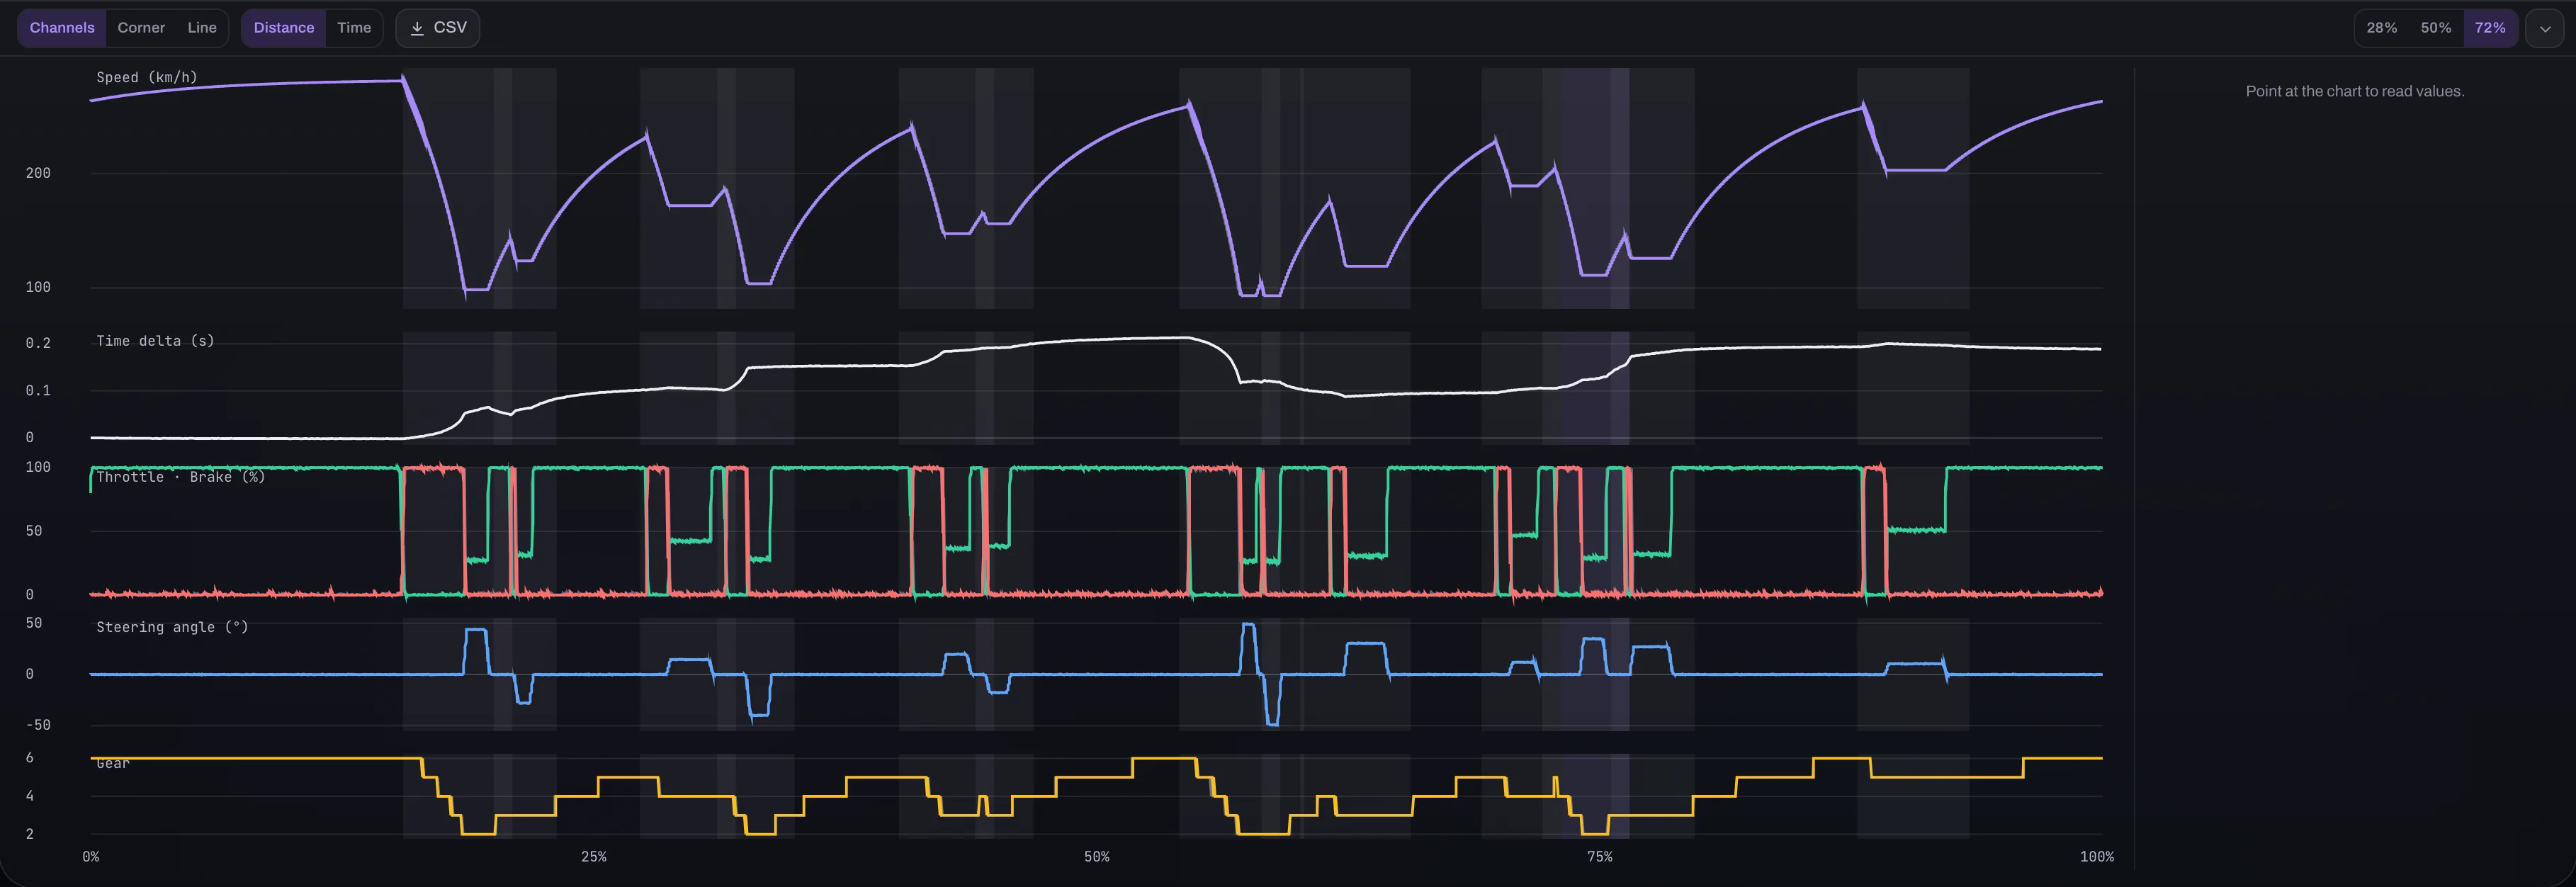
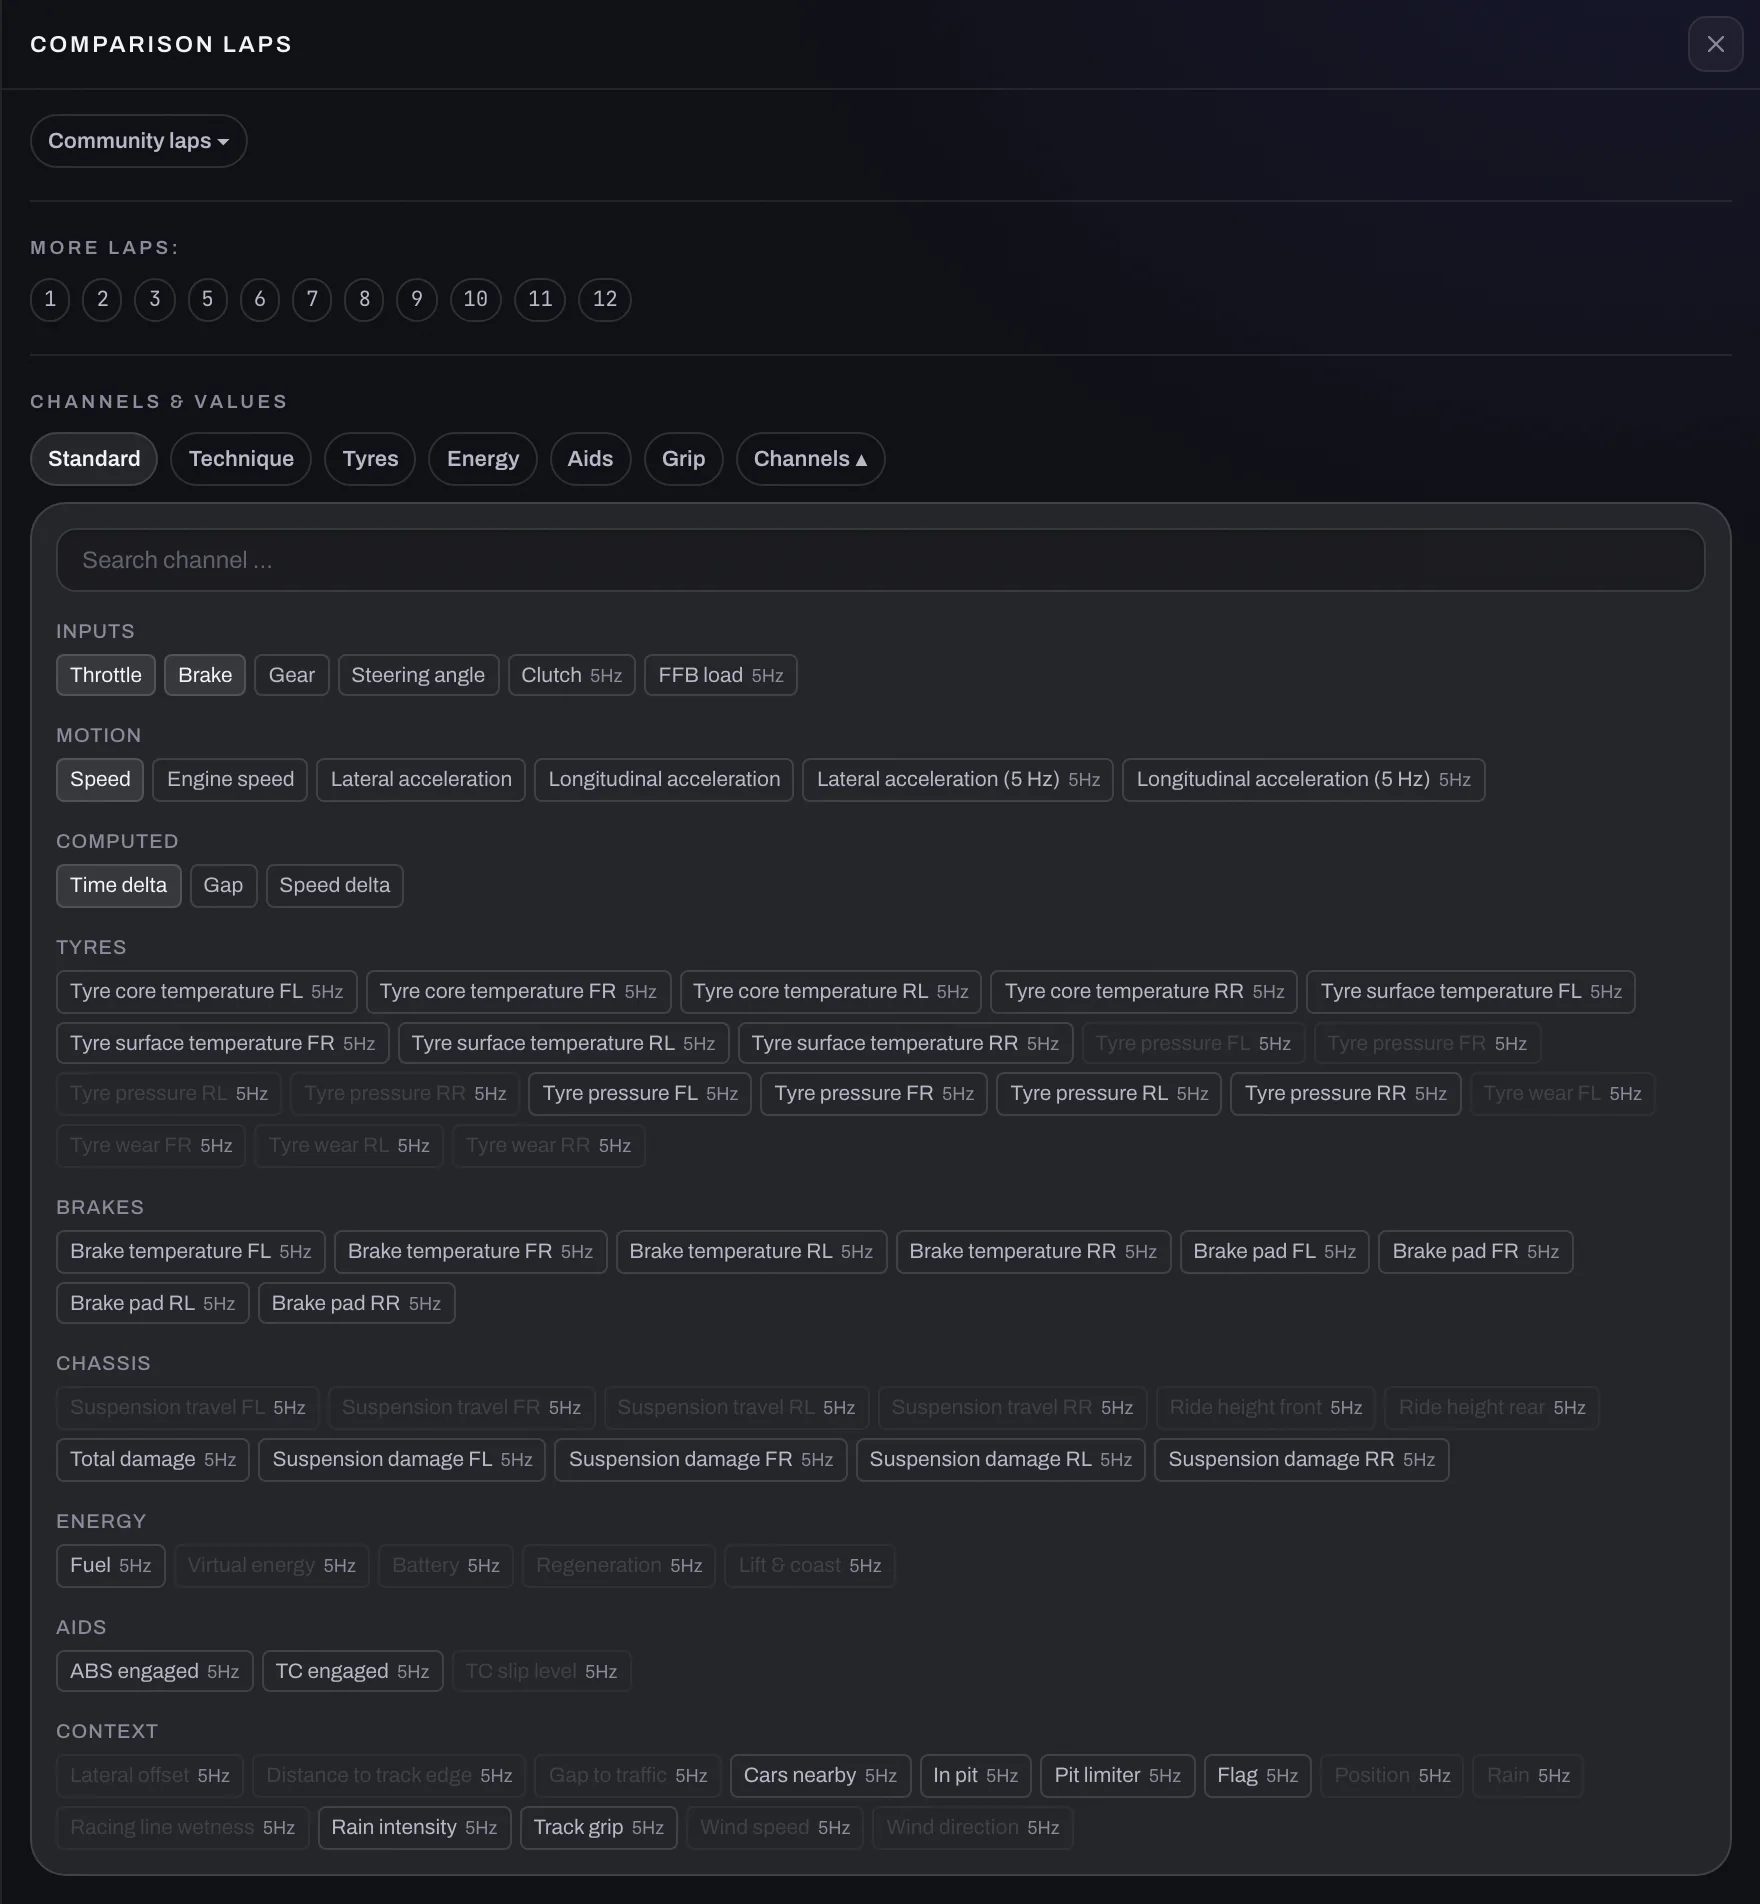
Up to 61 channels. Stacked, not one after another.
Core channels in every lap, plus the 5 Hz extra matrix your game delivers. Panels can be stacked, dragged for height and scaled individually; the axis runs over distance or over time, whichever you prefer.
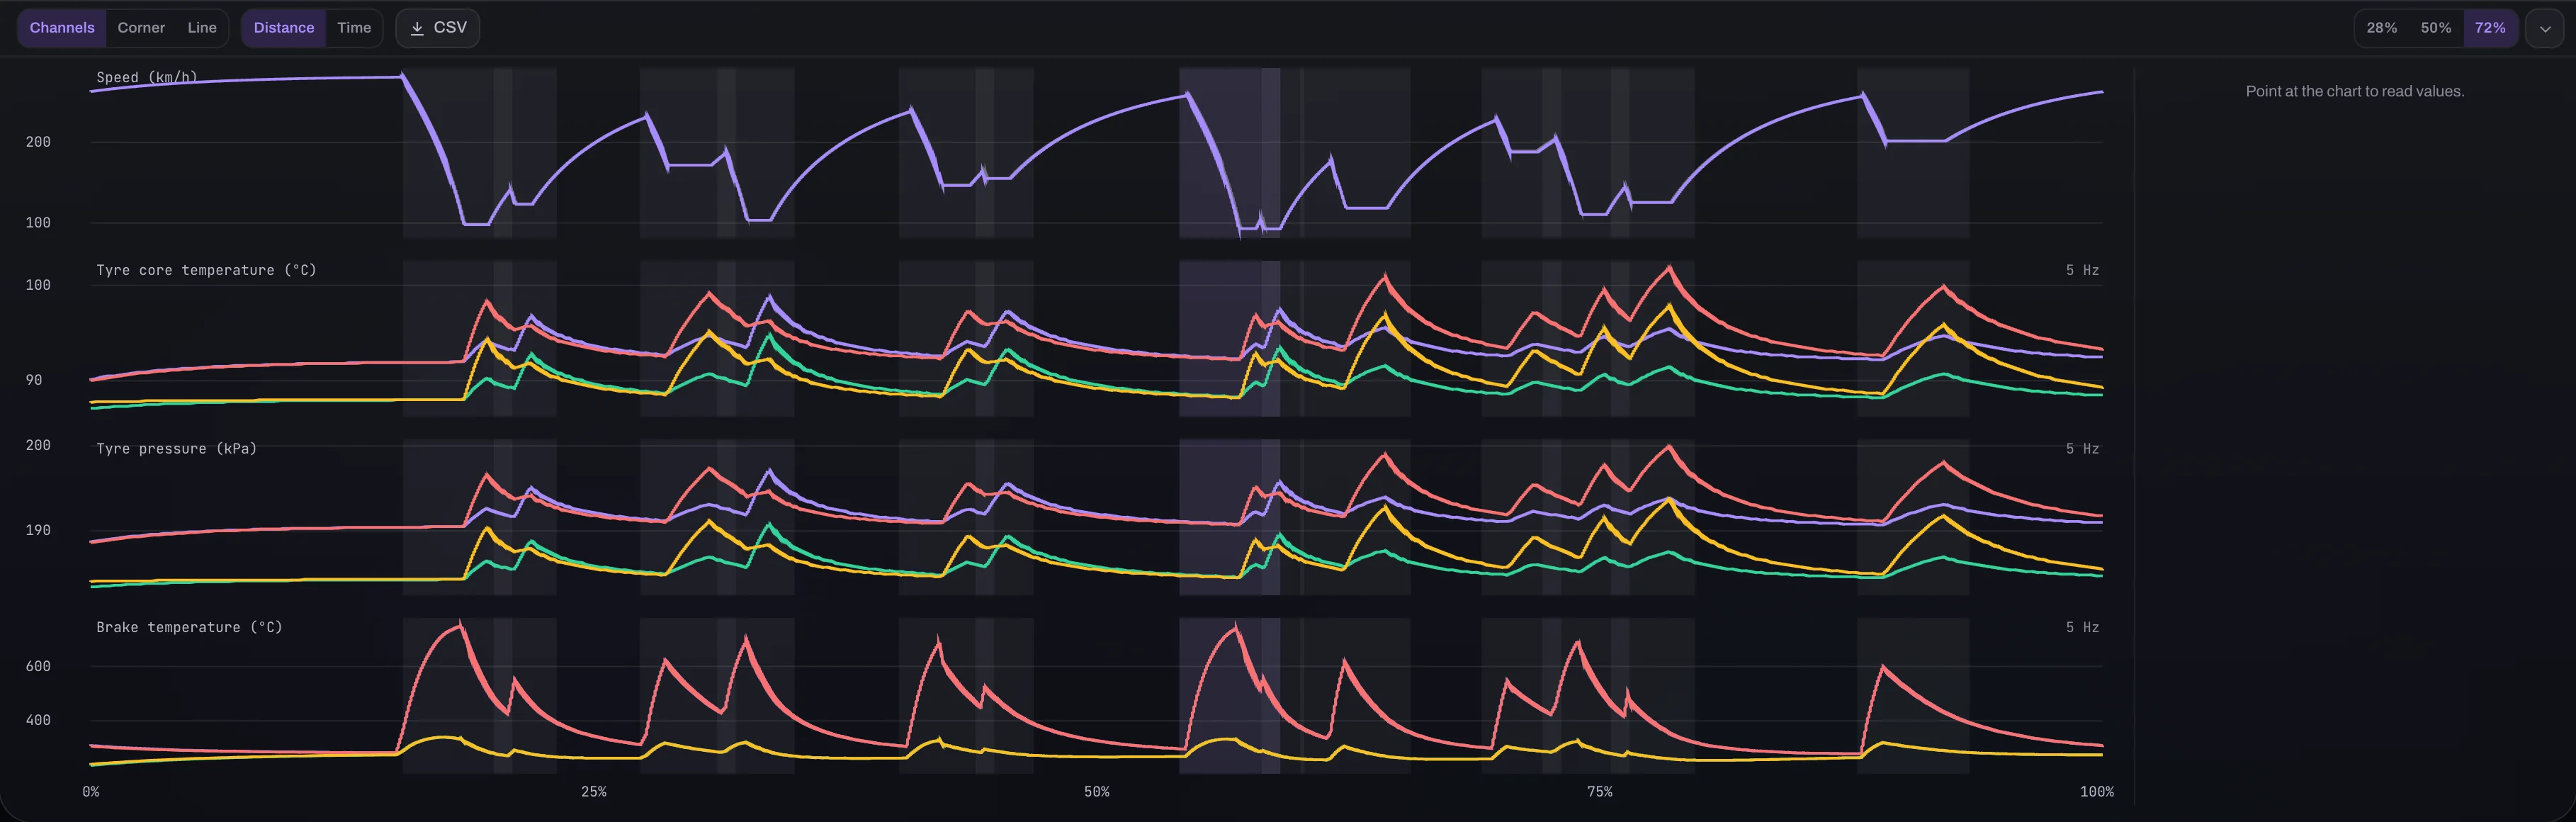
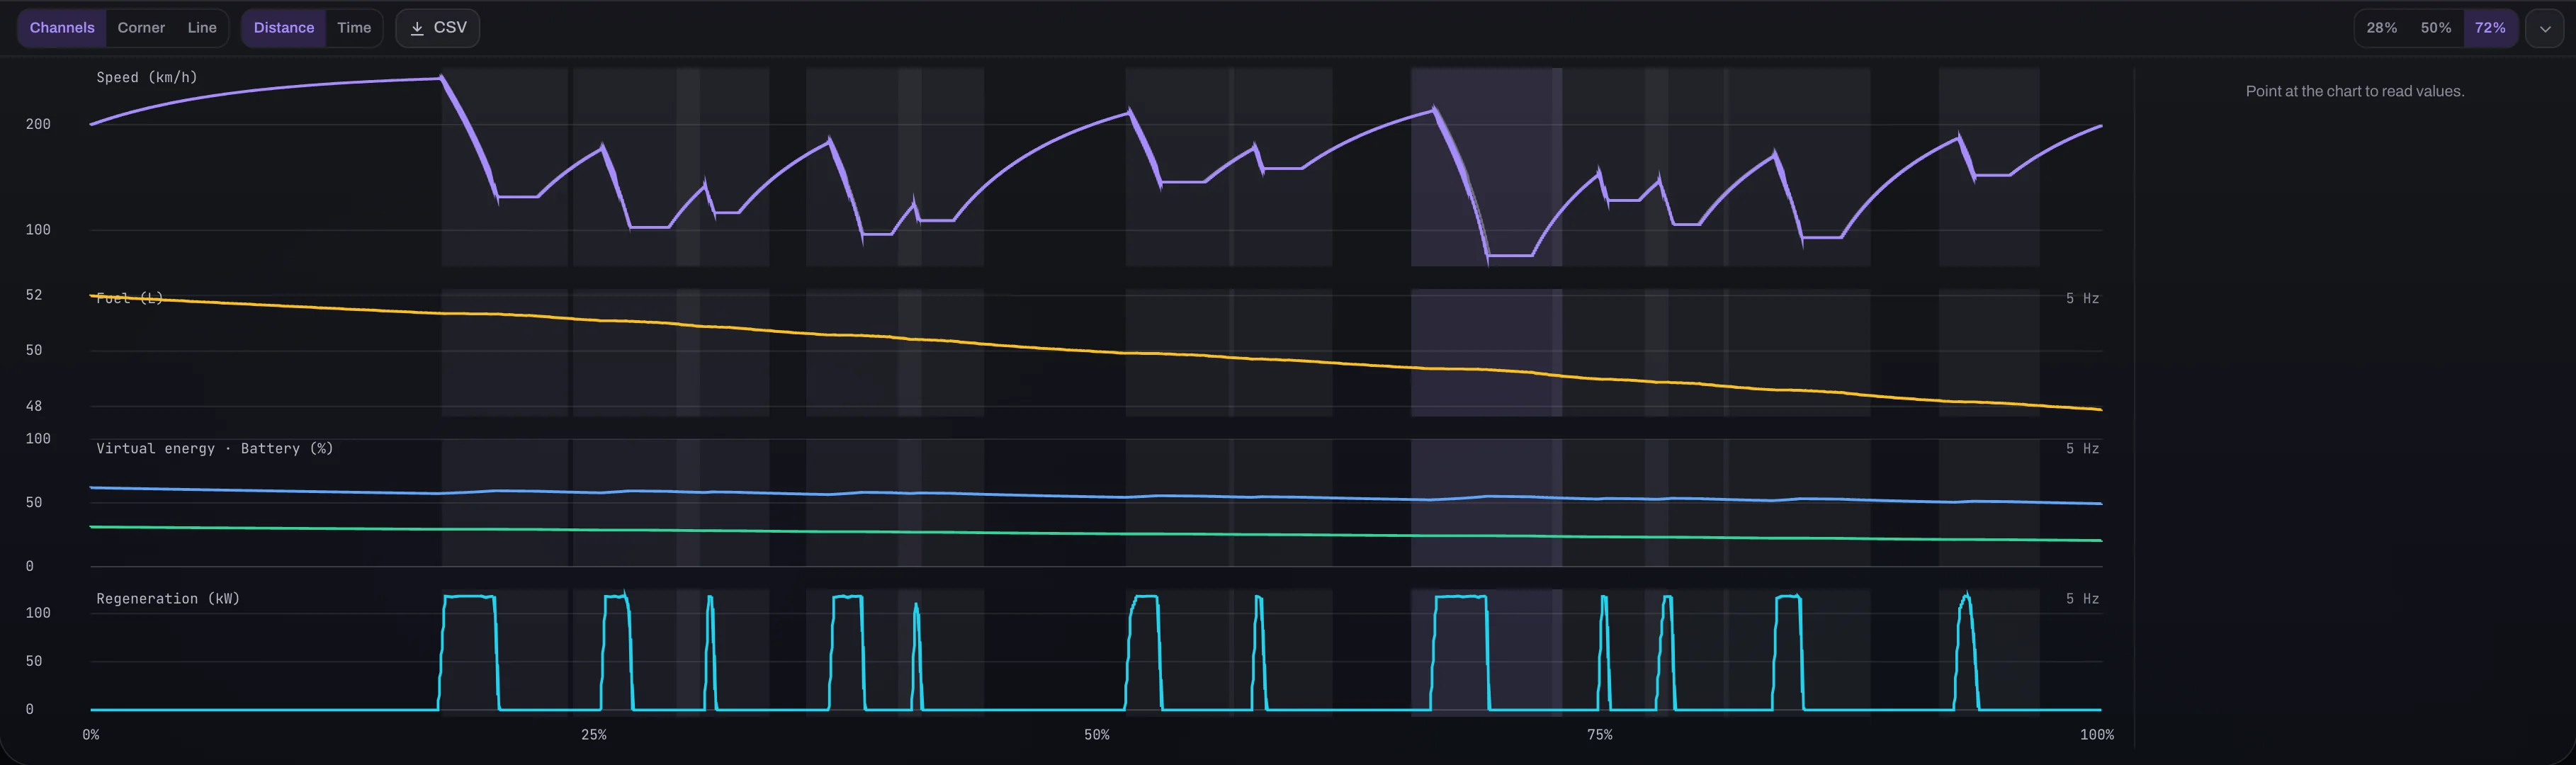
What actually arrives is up to the game: Le Mans Ultimate 61, Assetto Corsa Competizione 51, AC EVO 45, Assetto Corsa 26. No game delivers all 76 in the register — and no number on this page claims it does.
6 presets
Standard, Technique, Tyres, Energy, Aids, Grip. One click lays out the matching stack; every single channel can then be added or thrown out. Wheel channels always come as a set of four — four tyres belong side by side, not on four axes.
Two cursors
One follows the mouse across all panels, the track and the conditions strip at once. The second one gets pinned and measures from there — the length of a braking zone in metres and milliseconds, instead of guessing it.
5 Hz looks like 5 Hz
A channel with five samples per second is drawn as a staircase with visible points and carries its rate on the panel. A smoothed curve would claim a resolution that was never measured.
CSV out
Whatever is in the stack right now comes along as CSV — one lap, a fixed 2000 rows. That is a convenient extract for your own spreadsheet, not a raw-data dump.
Four phases, one corner.
The lap is broken down into corners and straights, and every segment gets its share of the time loss. Pick one and the workbench takes it apart: braking, turn-in, apex, acceleration — with your value, the reference lap's and the difference next to it.
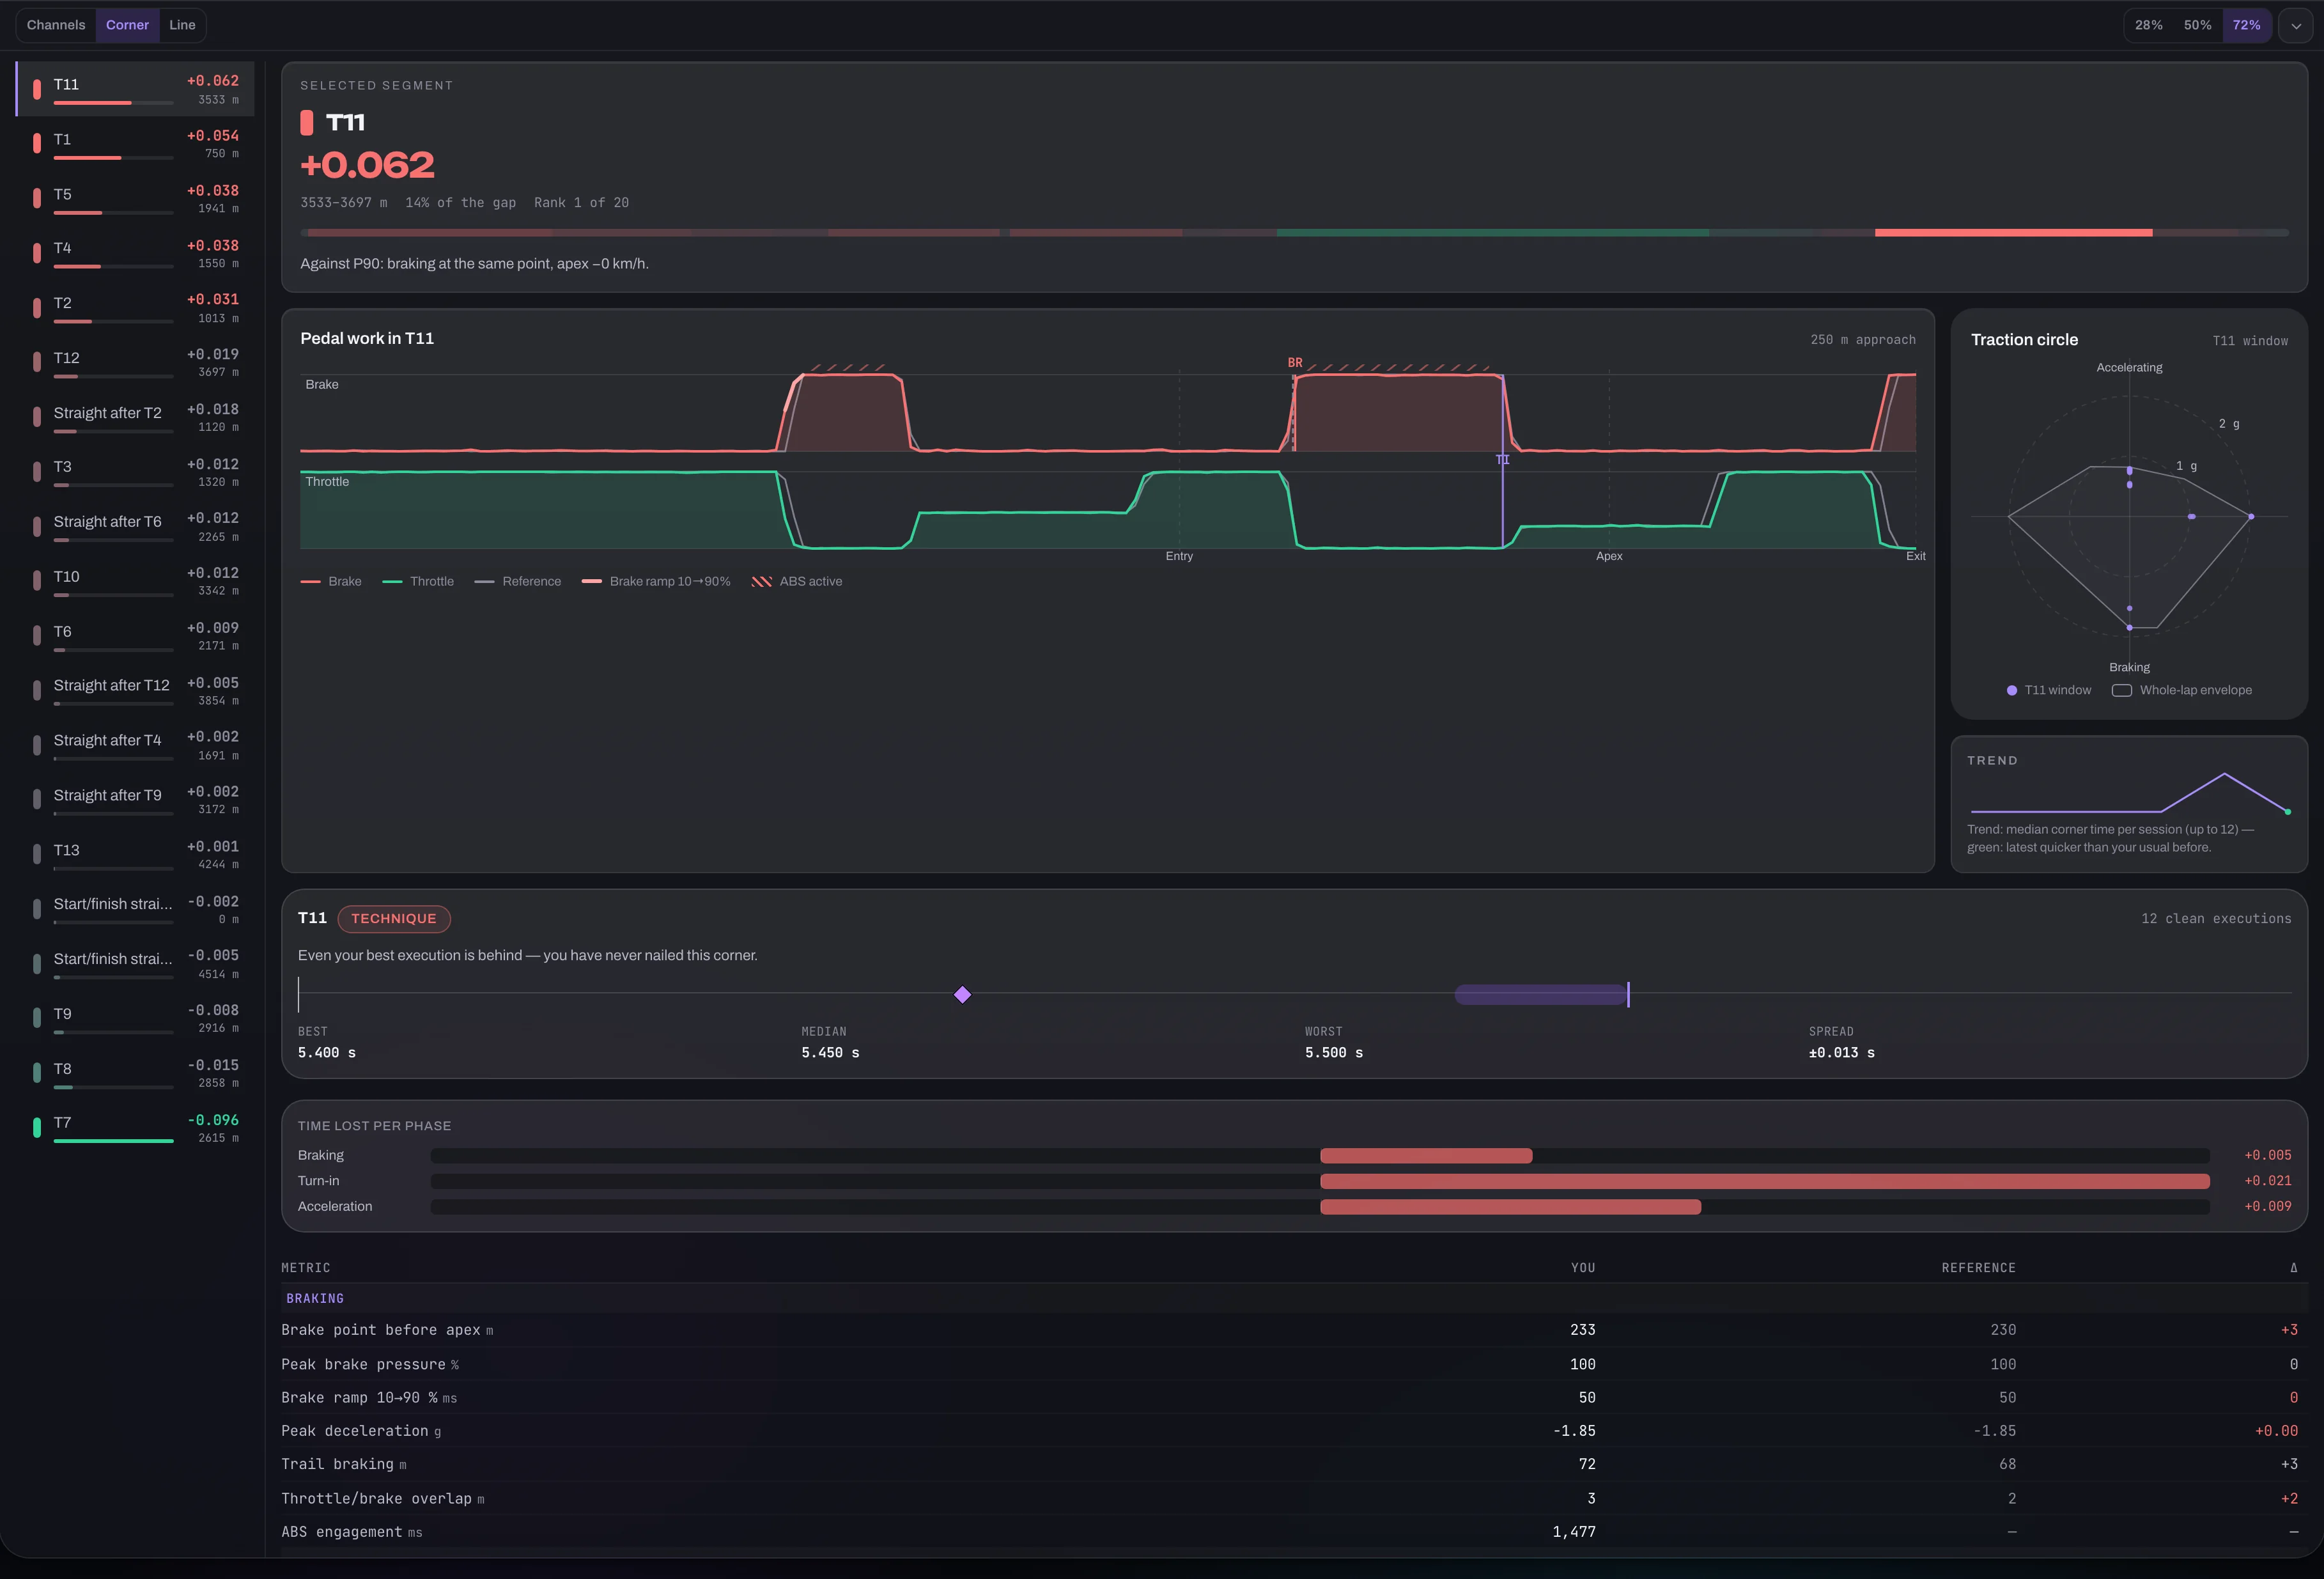
Numbers instead of impressions
Braking point before the apex in metres, peak pressure, brake ramp from 10 to 90 %, peak deceleration, trail-braking length, pedal overlap, ABS engagement time, steering angle and corrections, entry, minimum and exit speed, apex offset, lateral acceleration including time at the plateau, throttle ramp, TC time, shifts.
Where exactly it is
The time loss of a corner is split across 4 phases. “0.021 s on turn-in” is an instruction; “two tenths in corner 11” is a number nobody can do anything with.
Spread across all laps
Best, median and worst execution of the same corner, with the range in between. A verdict falls out of that: technique, repeatability or instability — and whether your best execution has ever been at reference level at all.
Traction circle
Longitudinal against lateral acceleration, for the window of this corner and compared with the envelope of the whole lap. A dented corner means: grip is being left on the table here that the car gives you elsewhere.
Across sessions
For every corner the median time of the last sessions as a line. Not your best attempt — the median one, because only that shows whether something has stuck.
Where on the track, not just how fast.
The offset between your line and the reference line across the whole lap, in metres, inside or outside. Plus entry, apex and exit separately for each corner, the biggest deviations as a ranking and a zoom in which the two lines lie on top of each other to scale — with the braking point and turn-in point of both laps.
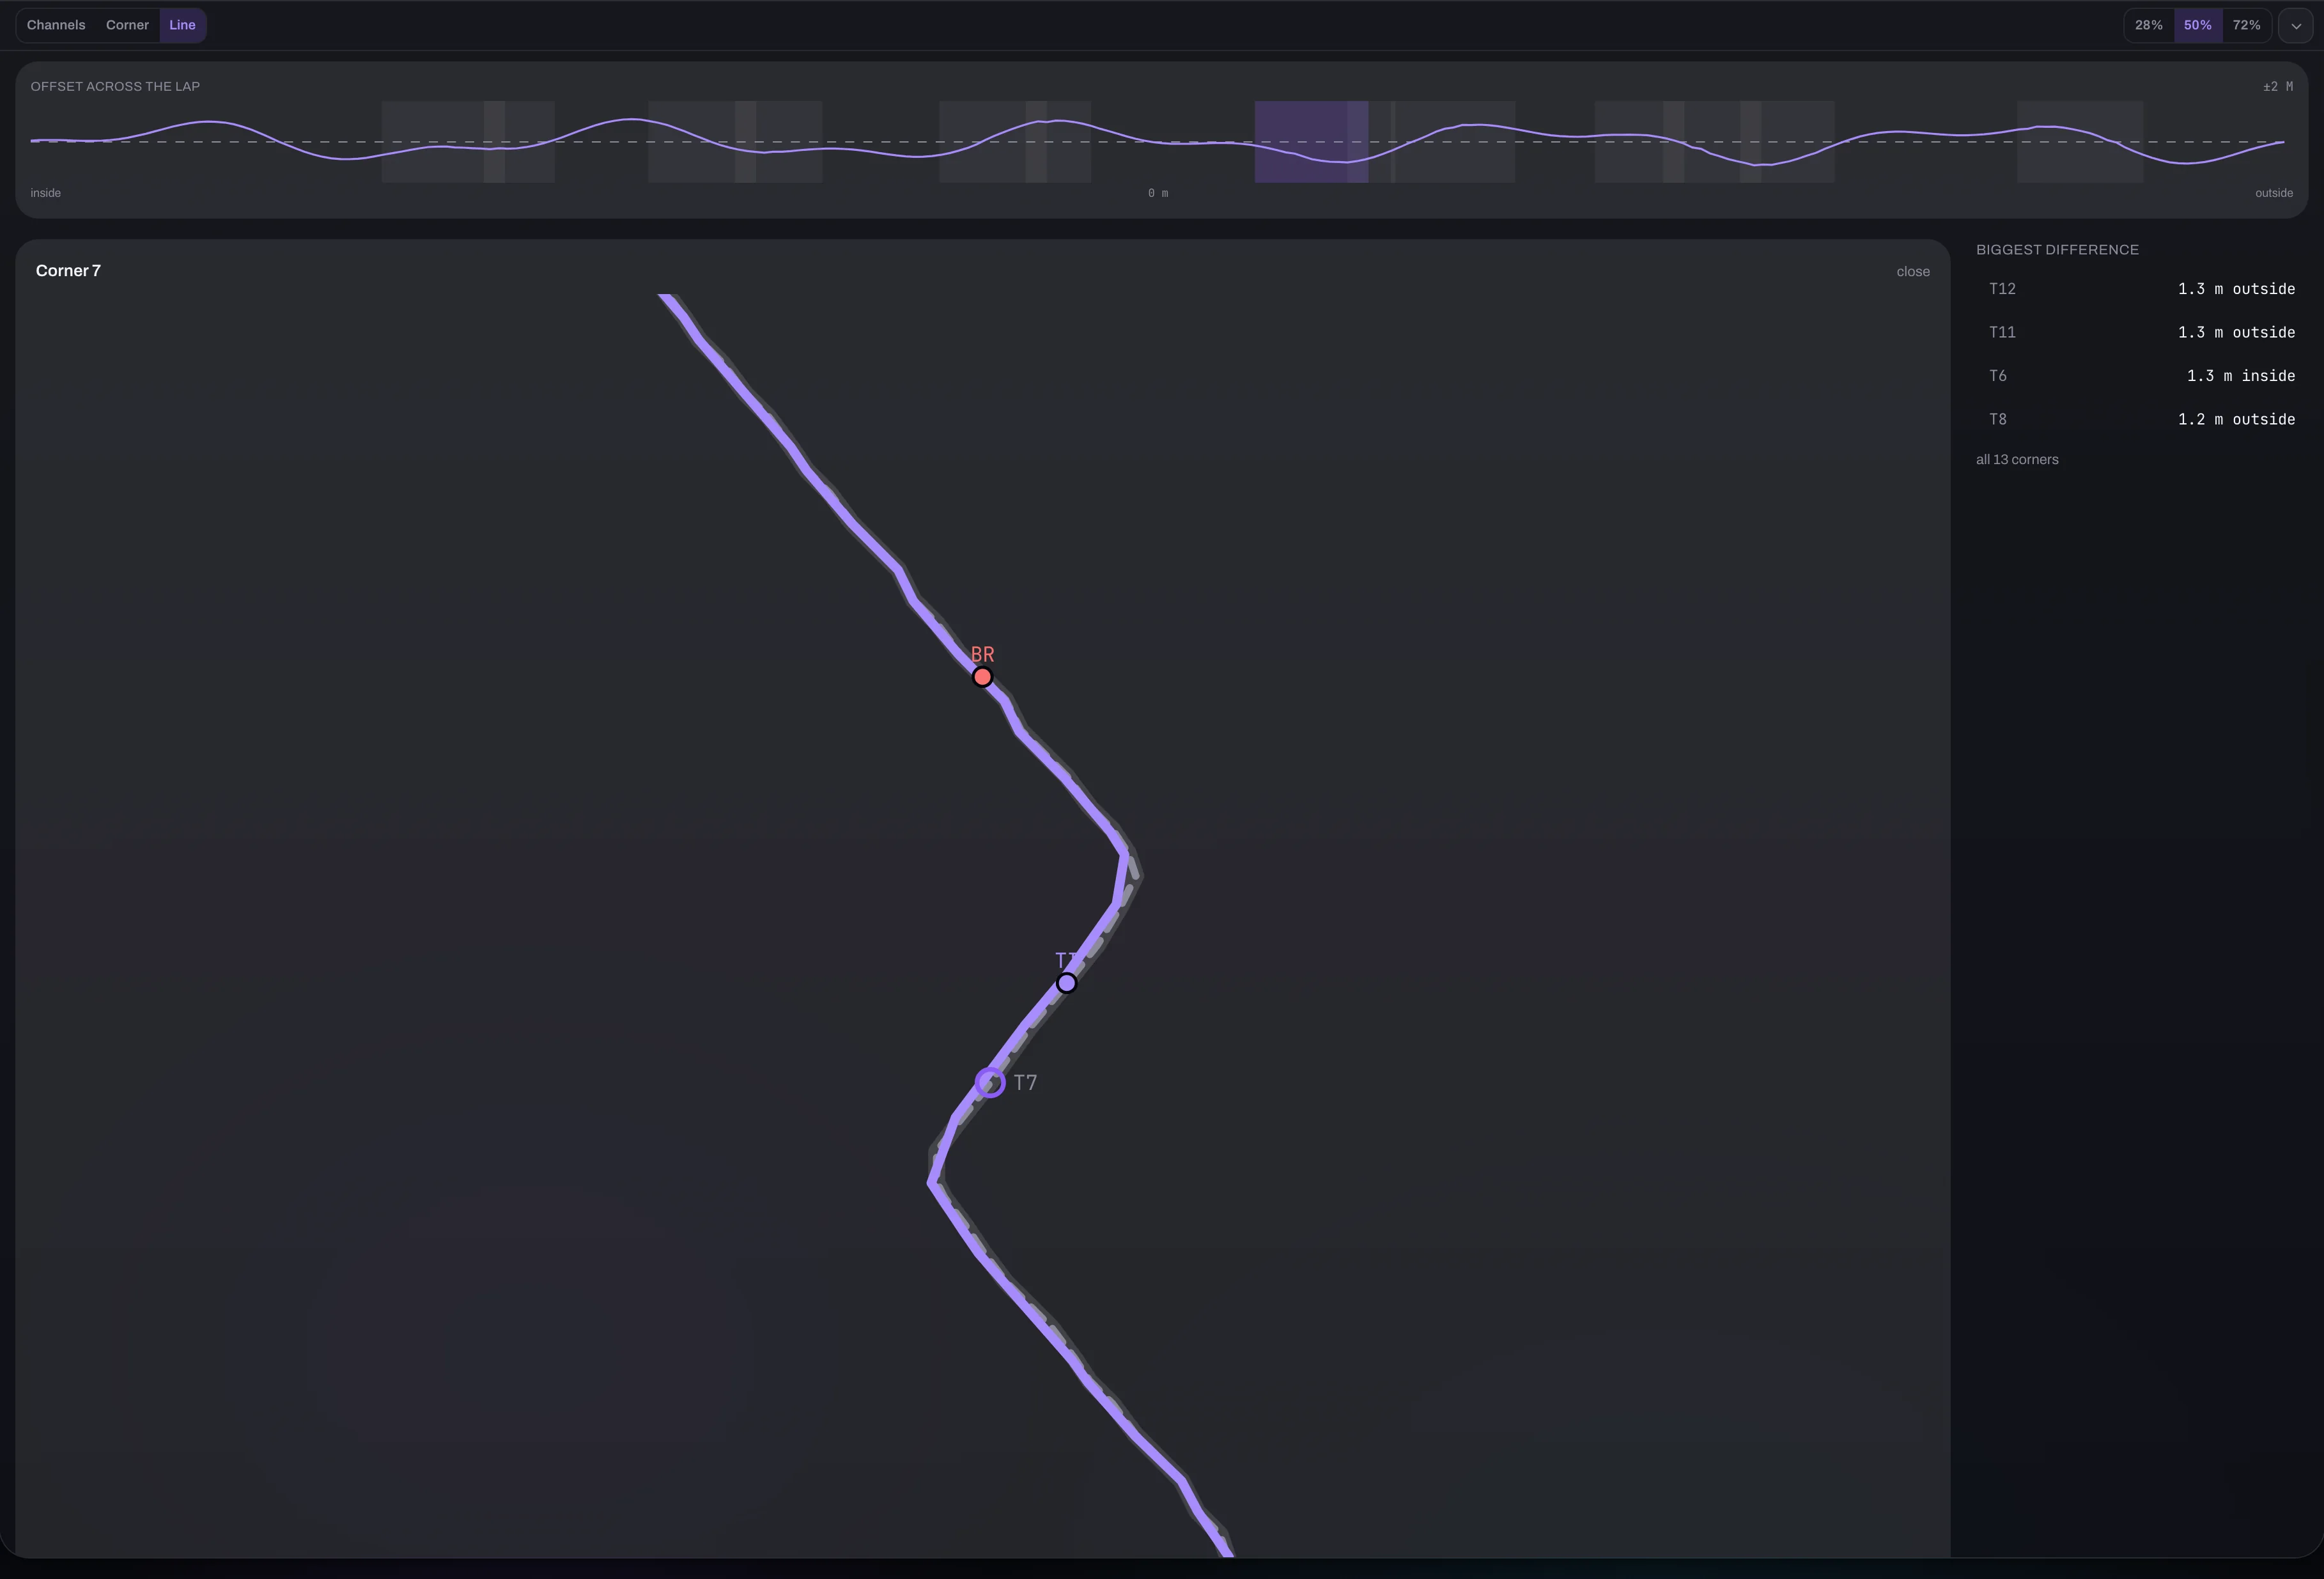
The track offset is only measured in Le Mans Ultimate: only that game reports the lateral distance to the centreline. In ACC, Assetto Corsa and AC EVO the line comes out of comparing two laps — there the reference lap sits on the centreline by construction, and the comparison tells you how far you deviate from IT, not from the edge of the track.
Findings, ranked by time to be gained.
The coach compares your session corner by corner against the reference lap and writes a list out of it: what happened, what to do and why — with the time to be gained and the spread next to it. One click opens the corner in the workspace.
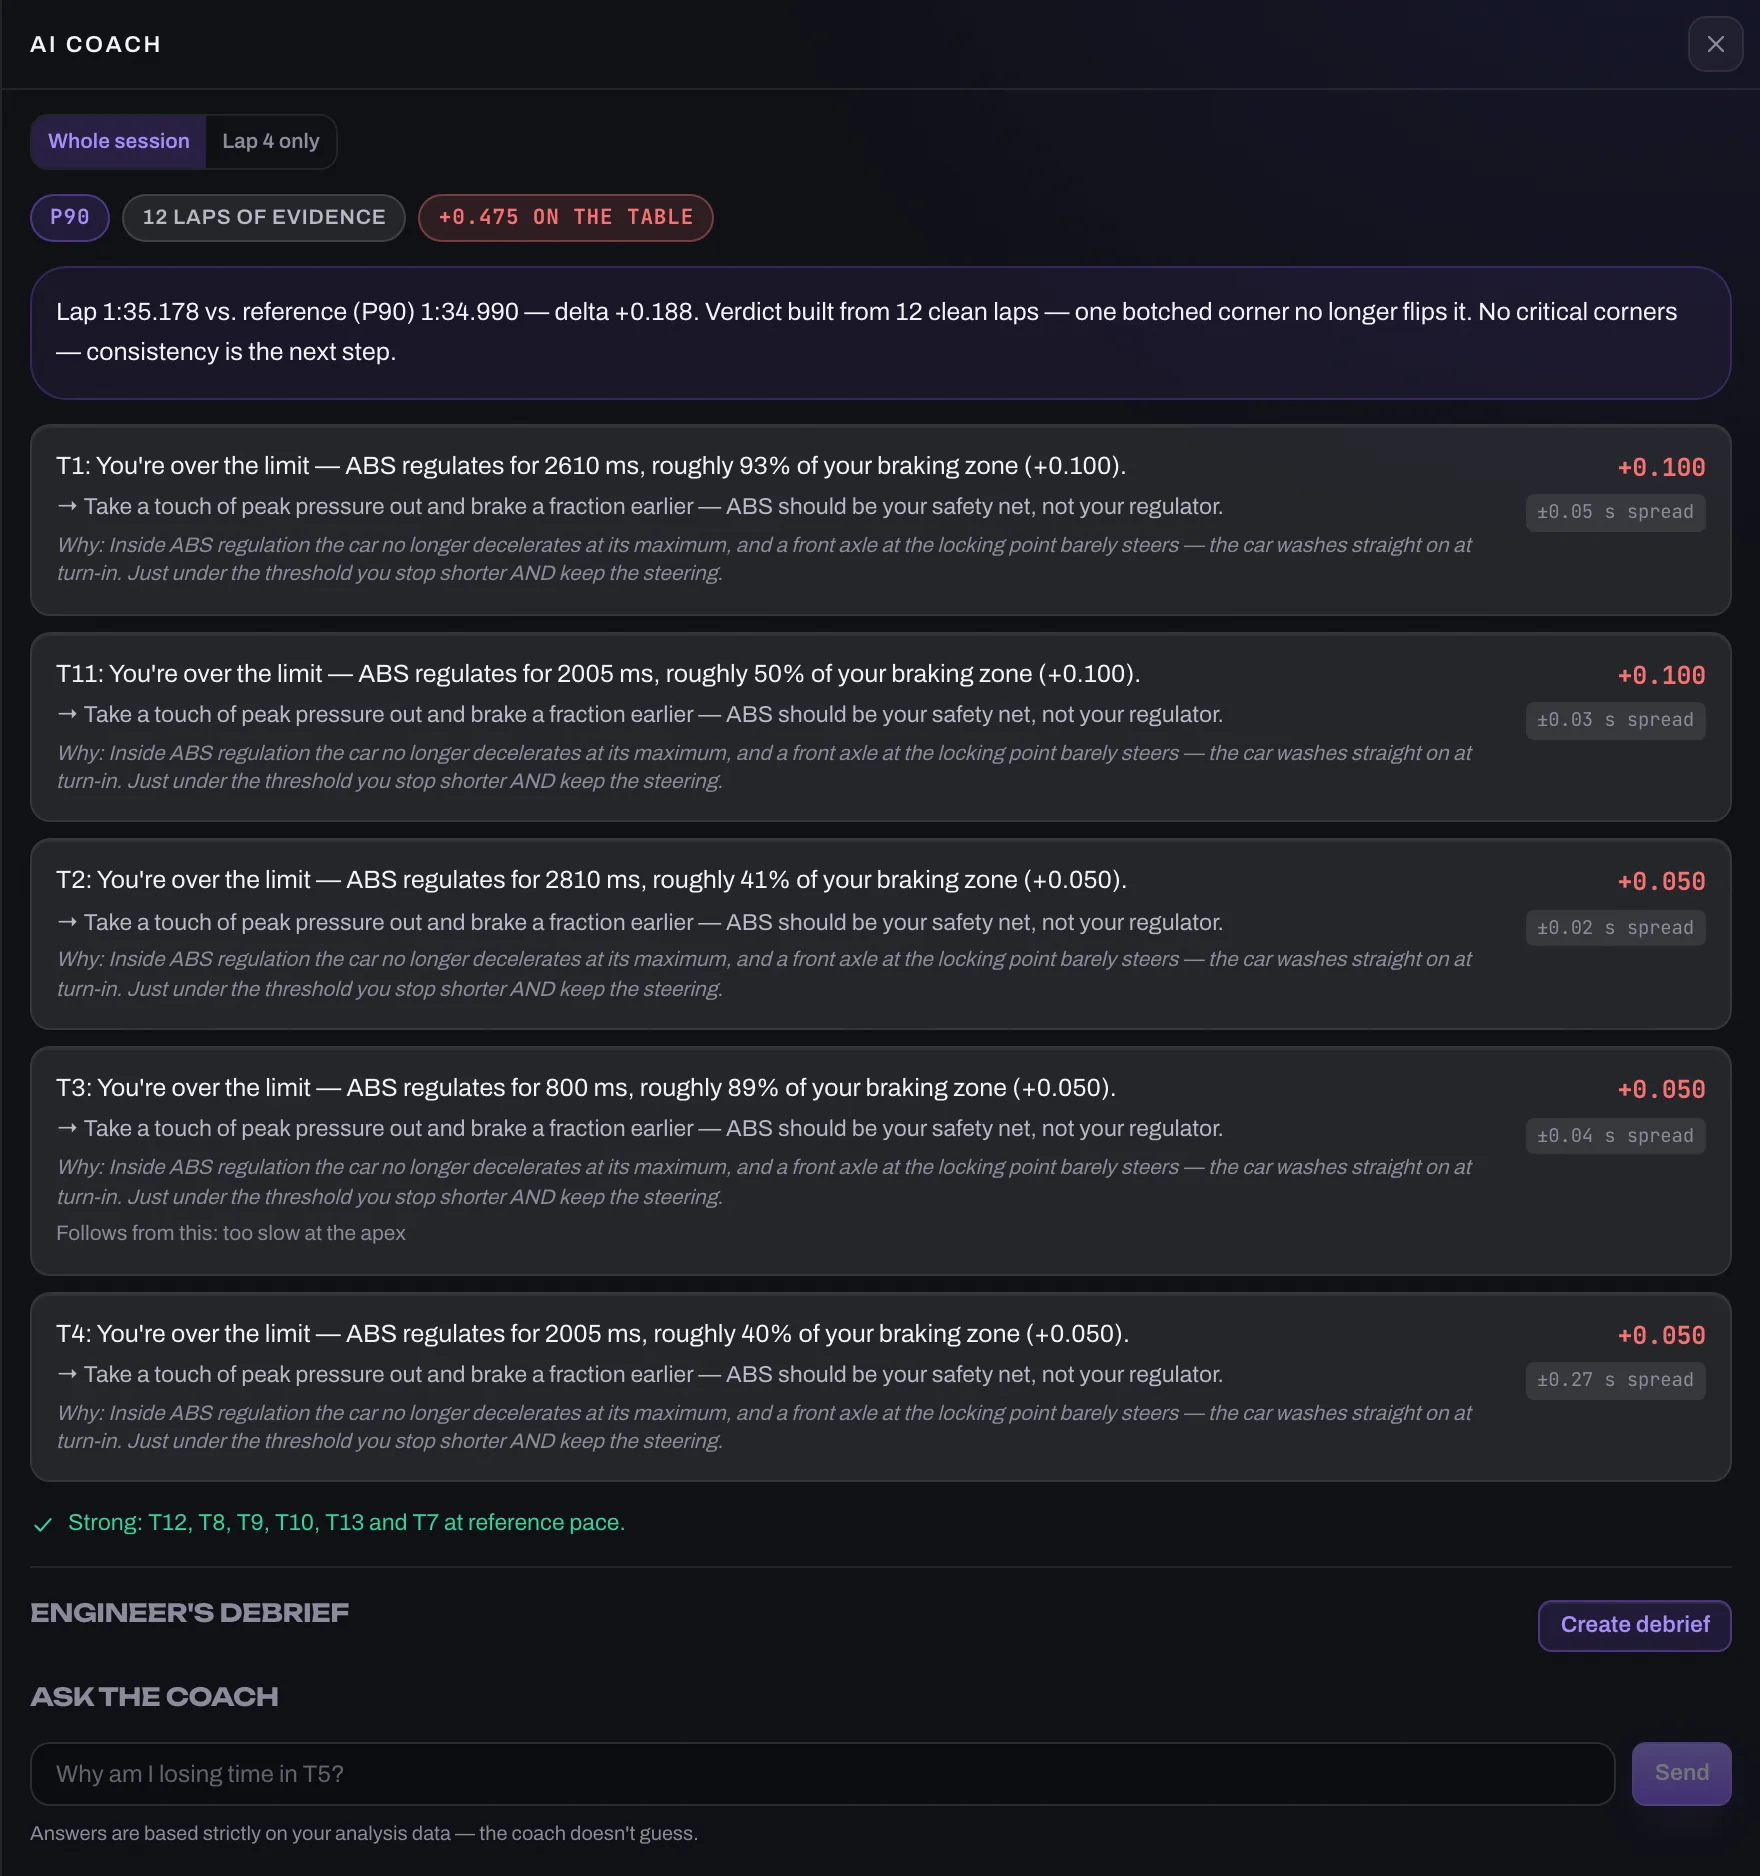
From all clean laps
The verdict does not rest on a single lap. One botched corner no longer tips it — the number of laps evaluated stands next to it as evidence.
The next step, not the highest
The default picks the percentile just above your pace. A comparison with the track record produces a list nobody can work on.
And when there is nothing
Then he says so. No finding is a result: it means the time is no longer in a corner, it is in repeatability.
The written engineer's debrief and the follow-up question in the chat are switched off during the public beta. What you see above is the deterministic analysis — it is the coach, not his warm-up act.
The session as a whole.
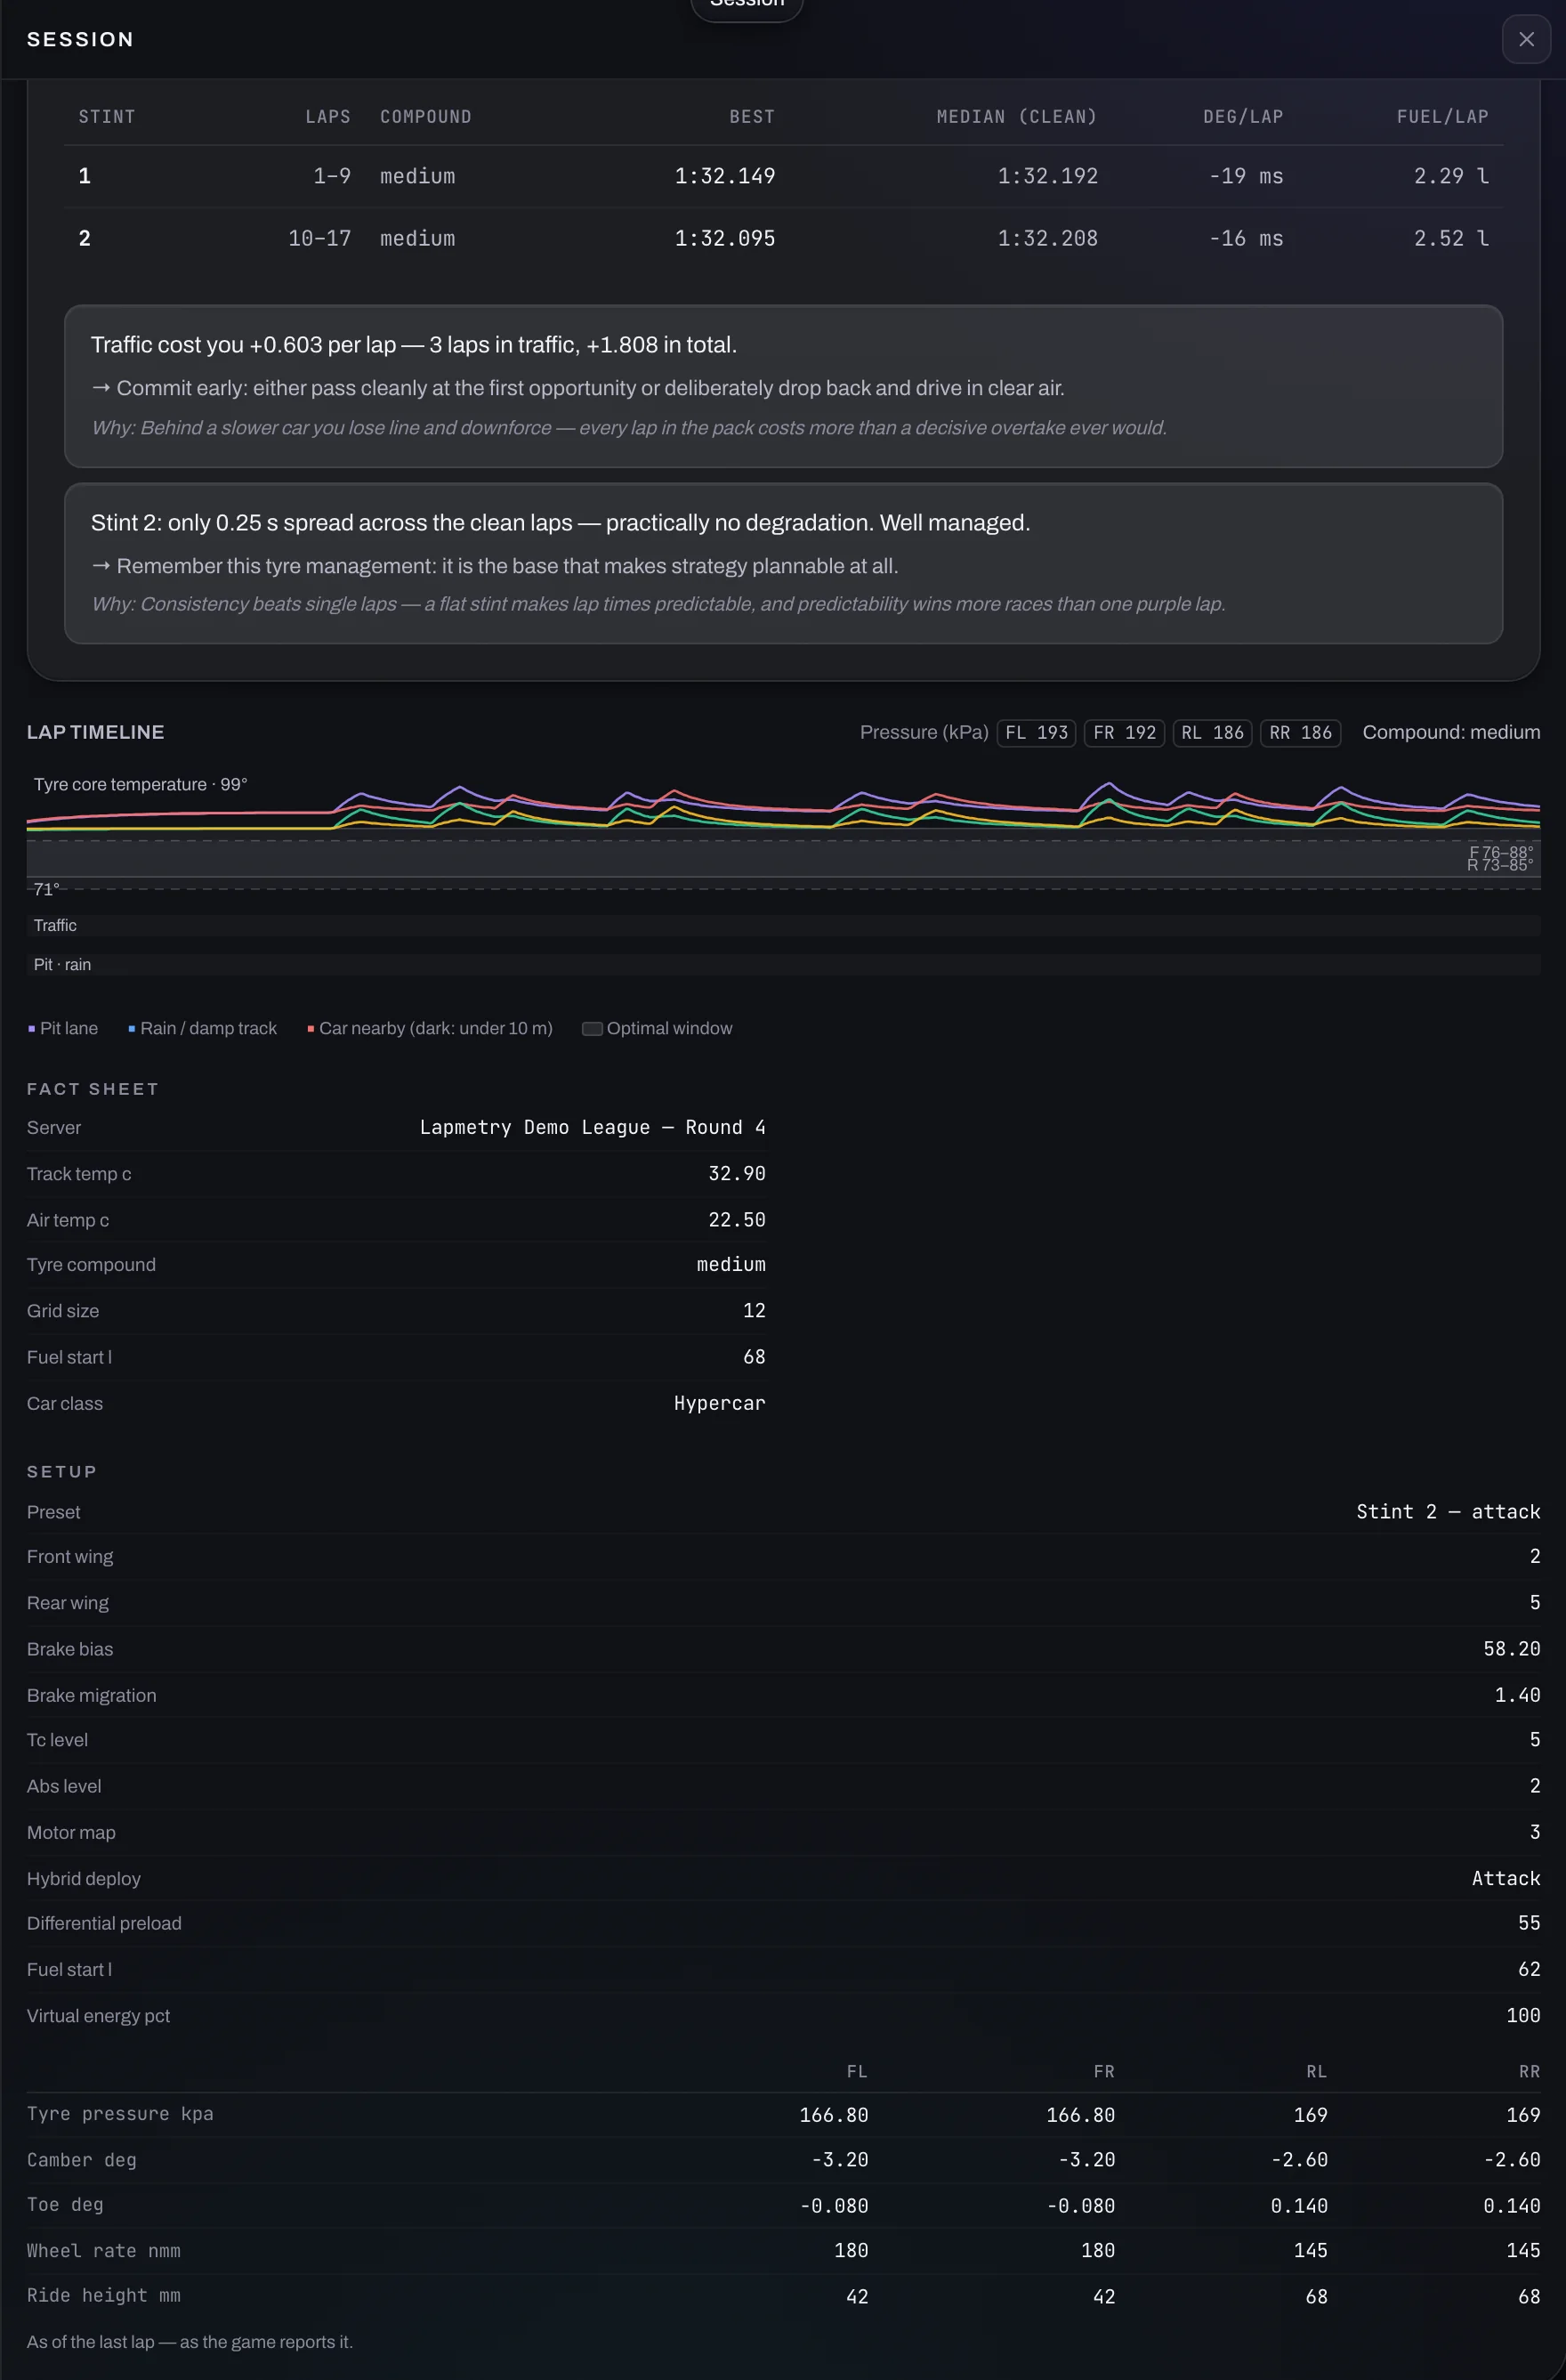
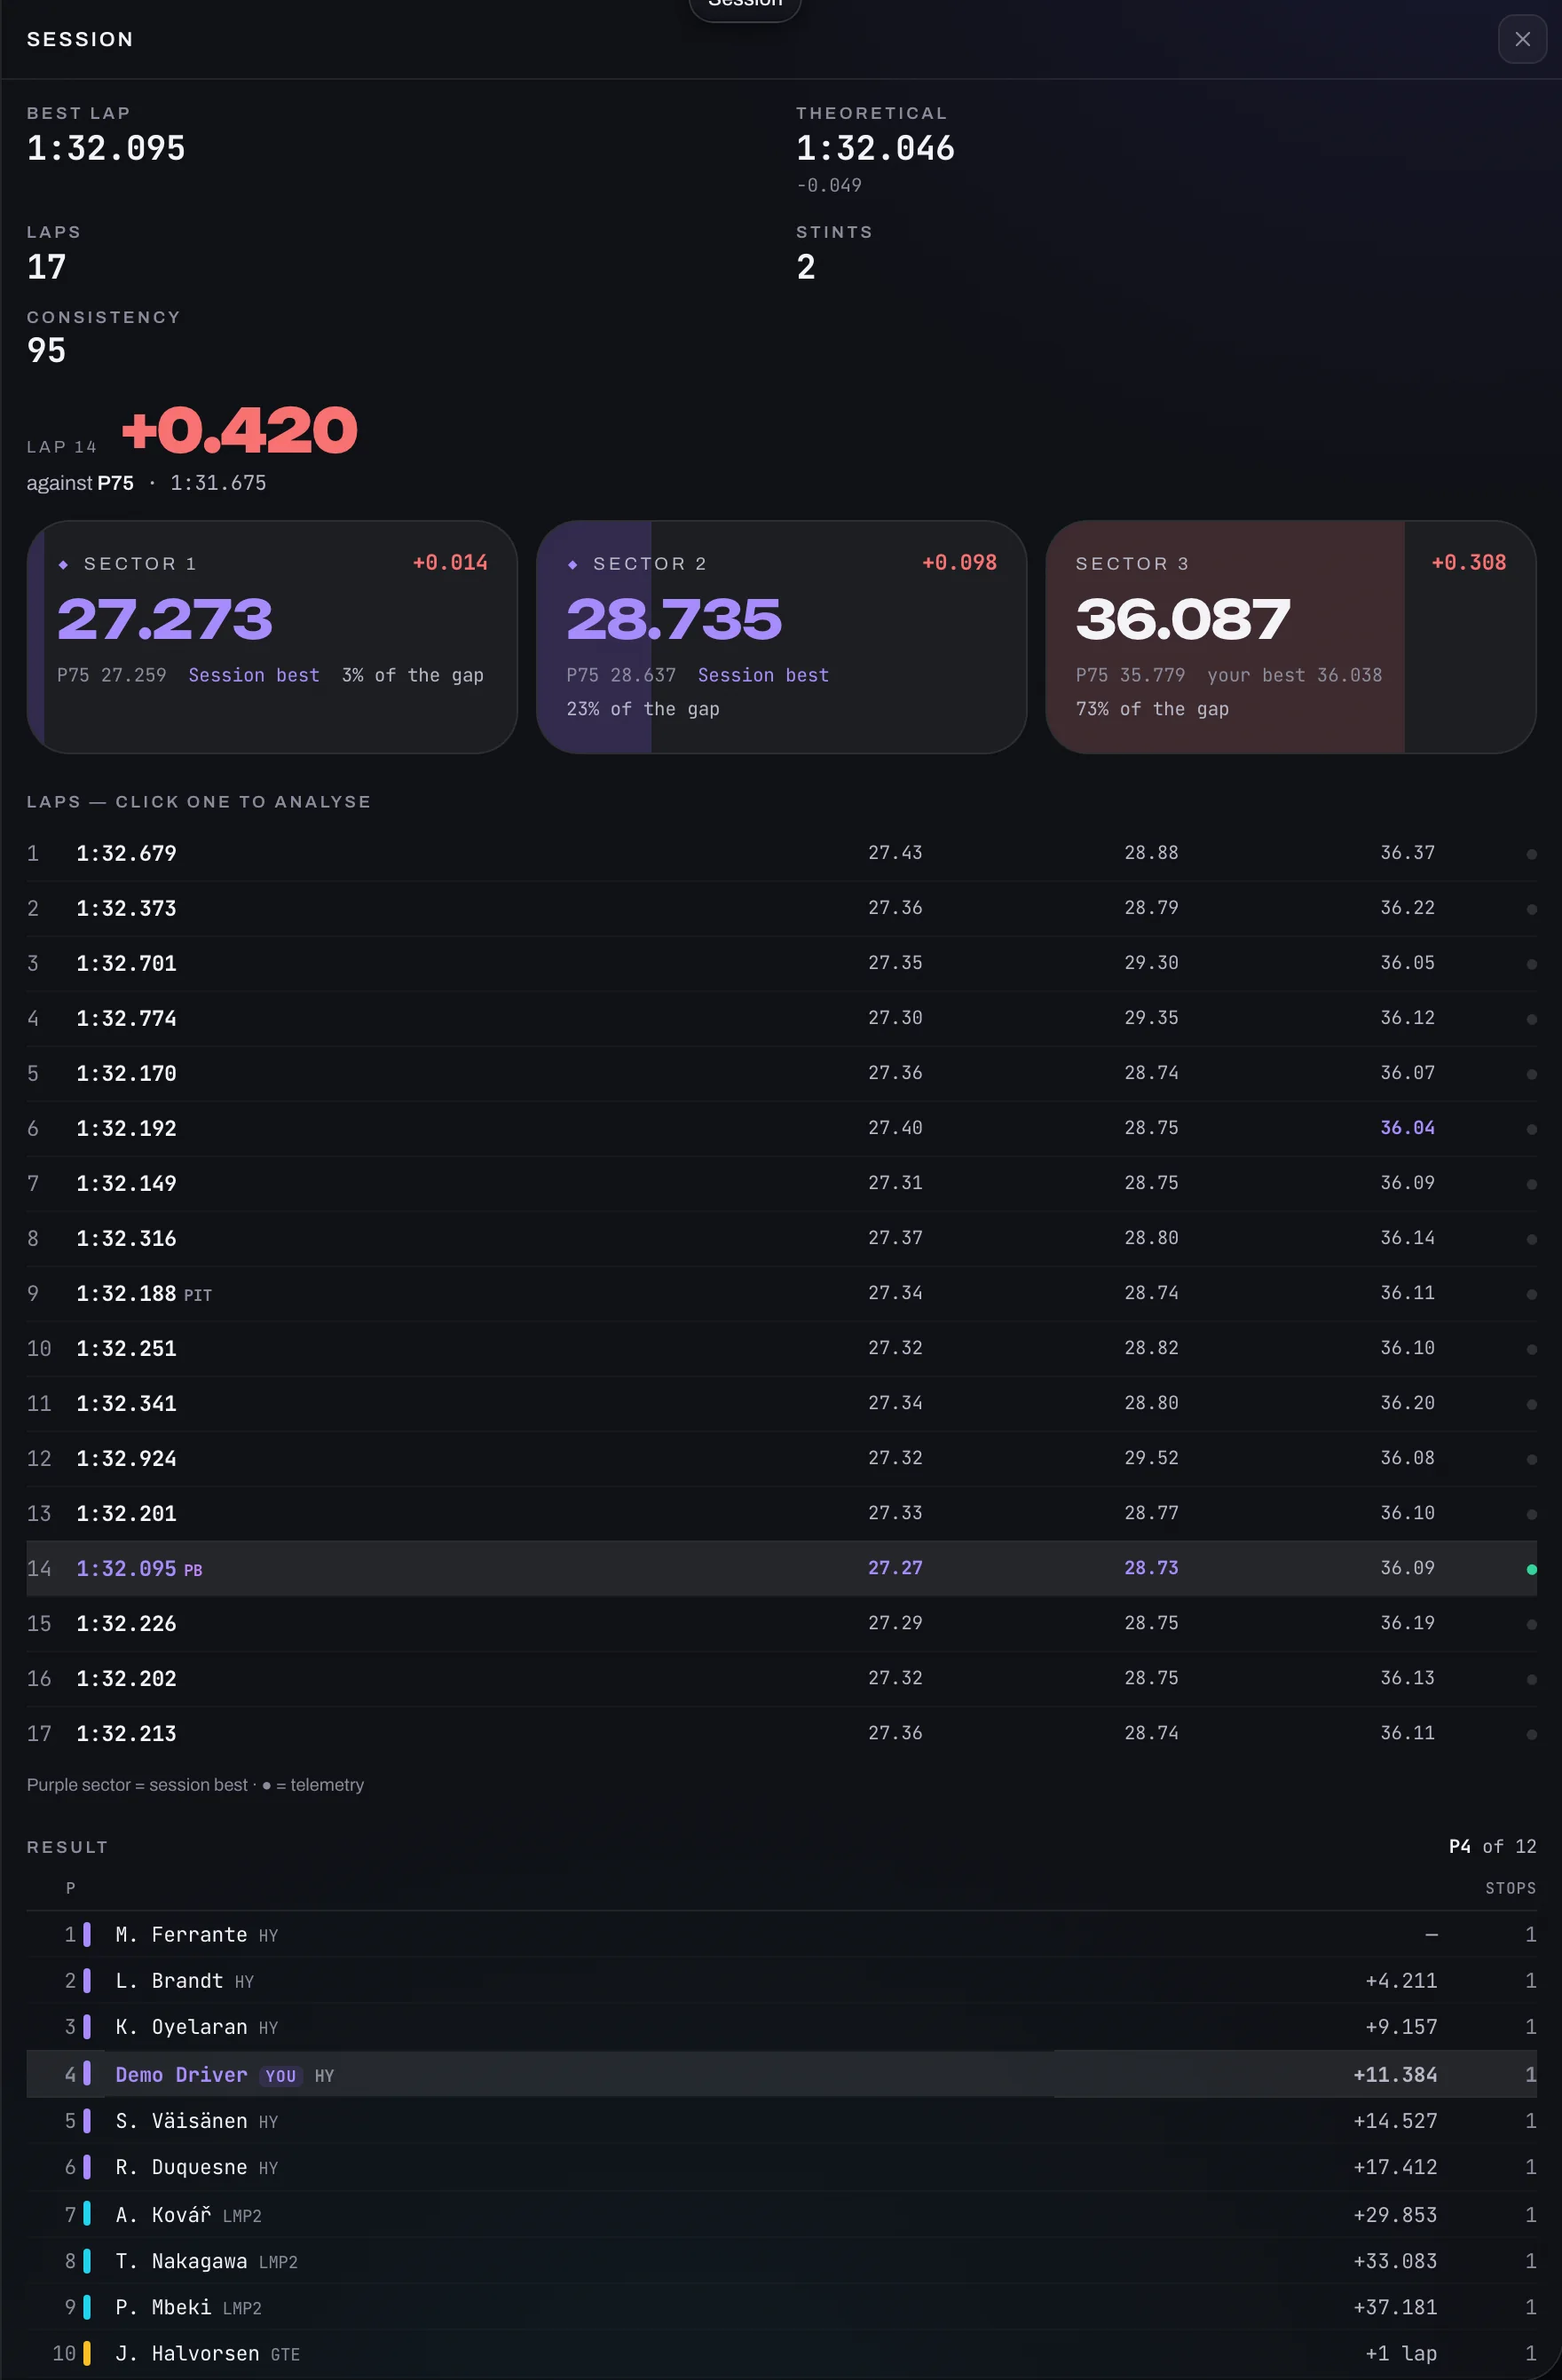
Lap table with sectors, pit stops and tyre changes; theoretical best lap from your best sectors; consistency as a number; and the fact sheet of what shaped this session.
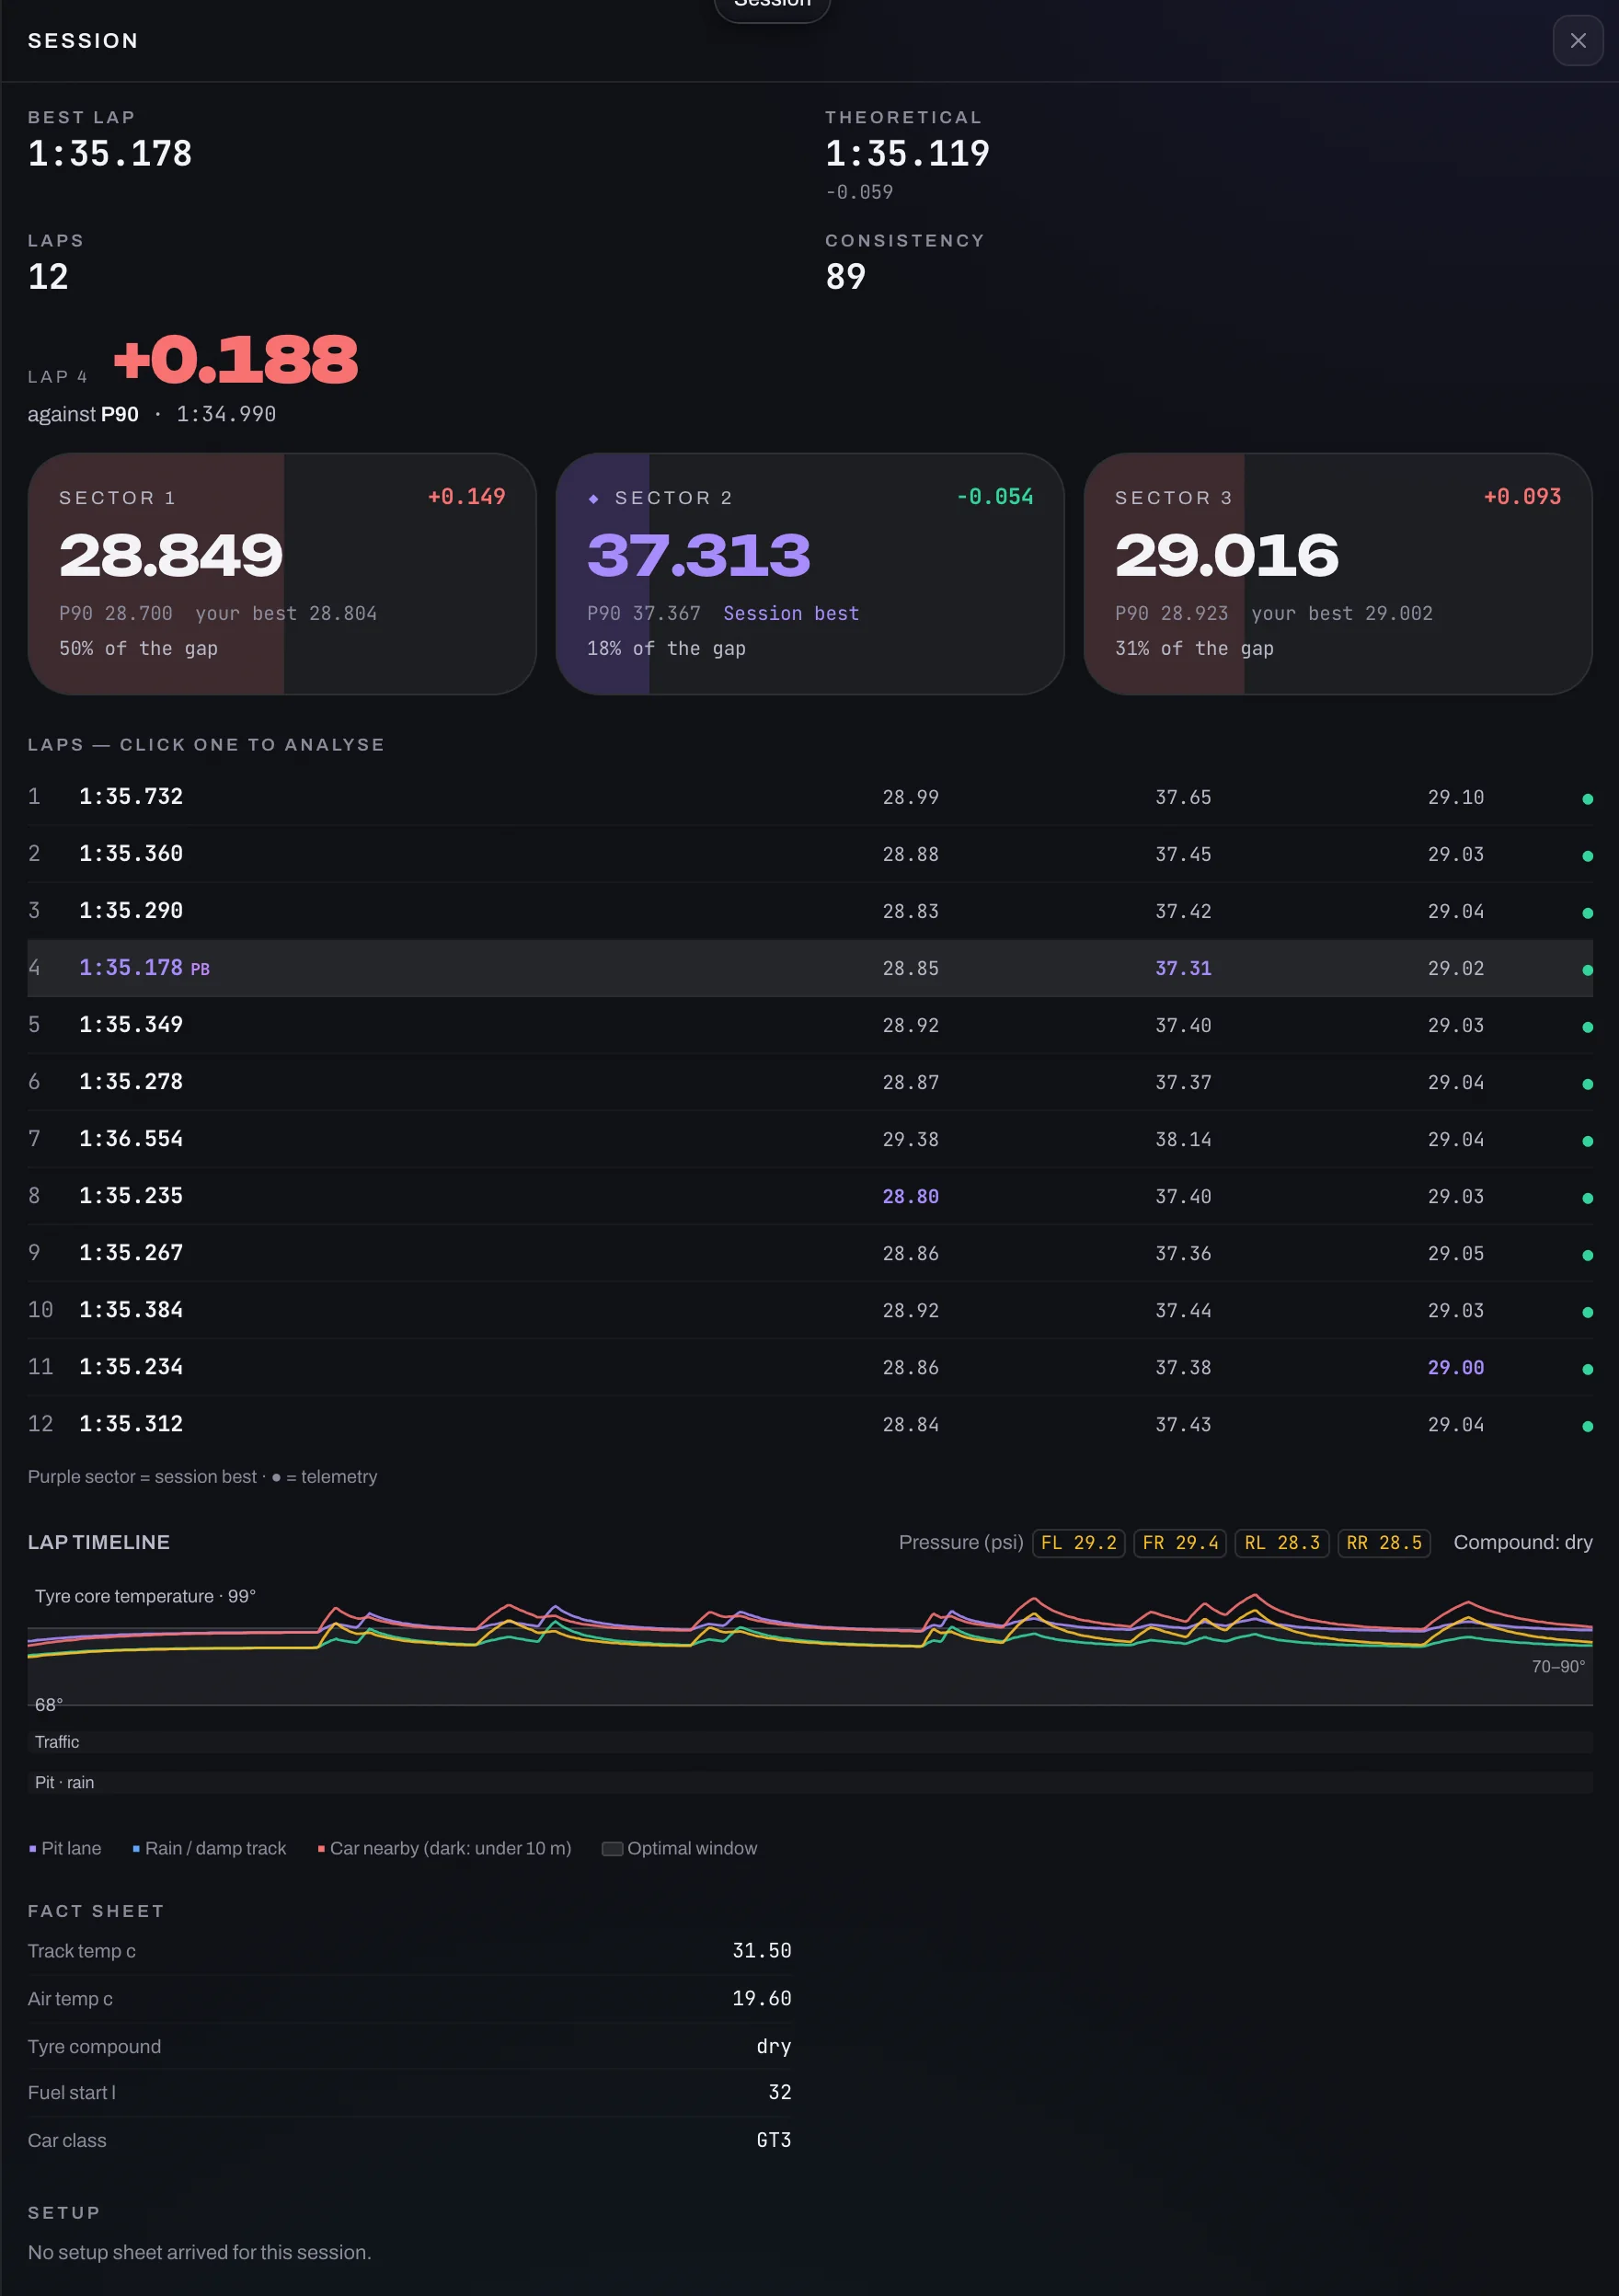
Consistency
A value from 0 to 100 out of the spread of your laps within 107 % of the best one. Below three clean laps it stays empty instead of inventing a statement out of two laps.
Conditions per lap
Tyre core temperatures against the optimal window, tyre pressure, traffic, pit lane, rain and track grip — timed exactly, below the charts. So next to the lap time stands what explains it.
Setup sheet
The setup driven on the last lap: wings, camber, toe, spring rates, ride height, brake balance, aid levels. Le Mans Ultimate sends it along; the other games do not hand it over.
The race beyond the fastest lap.
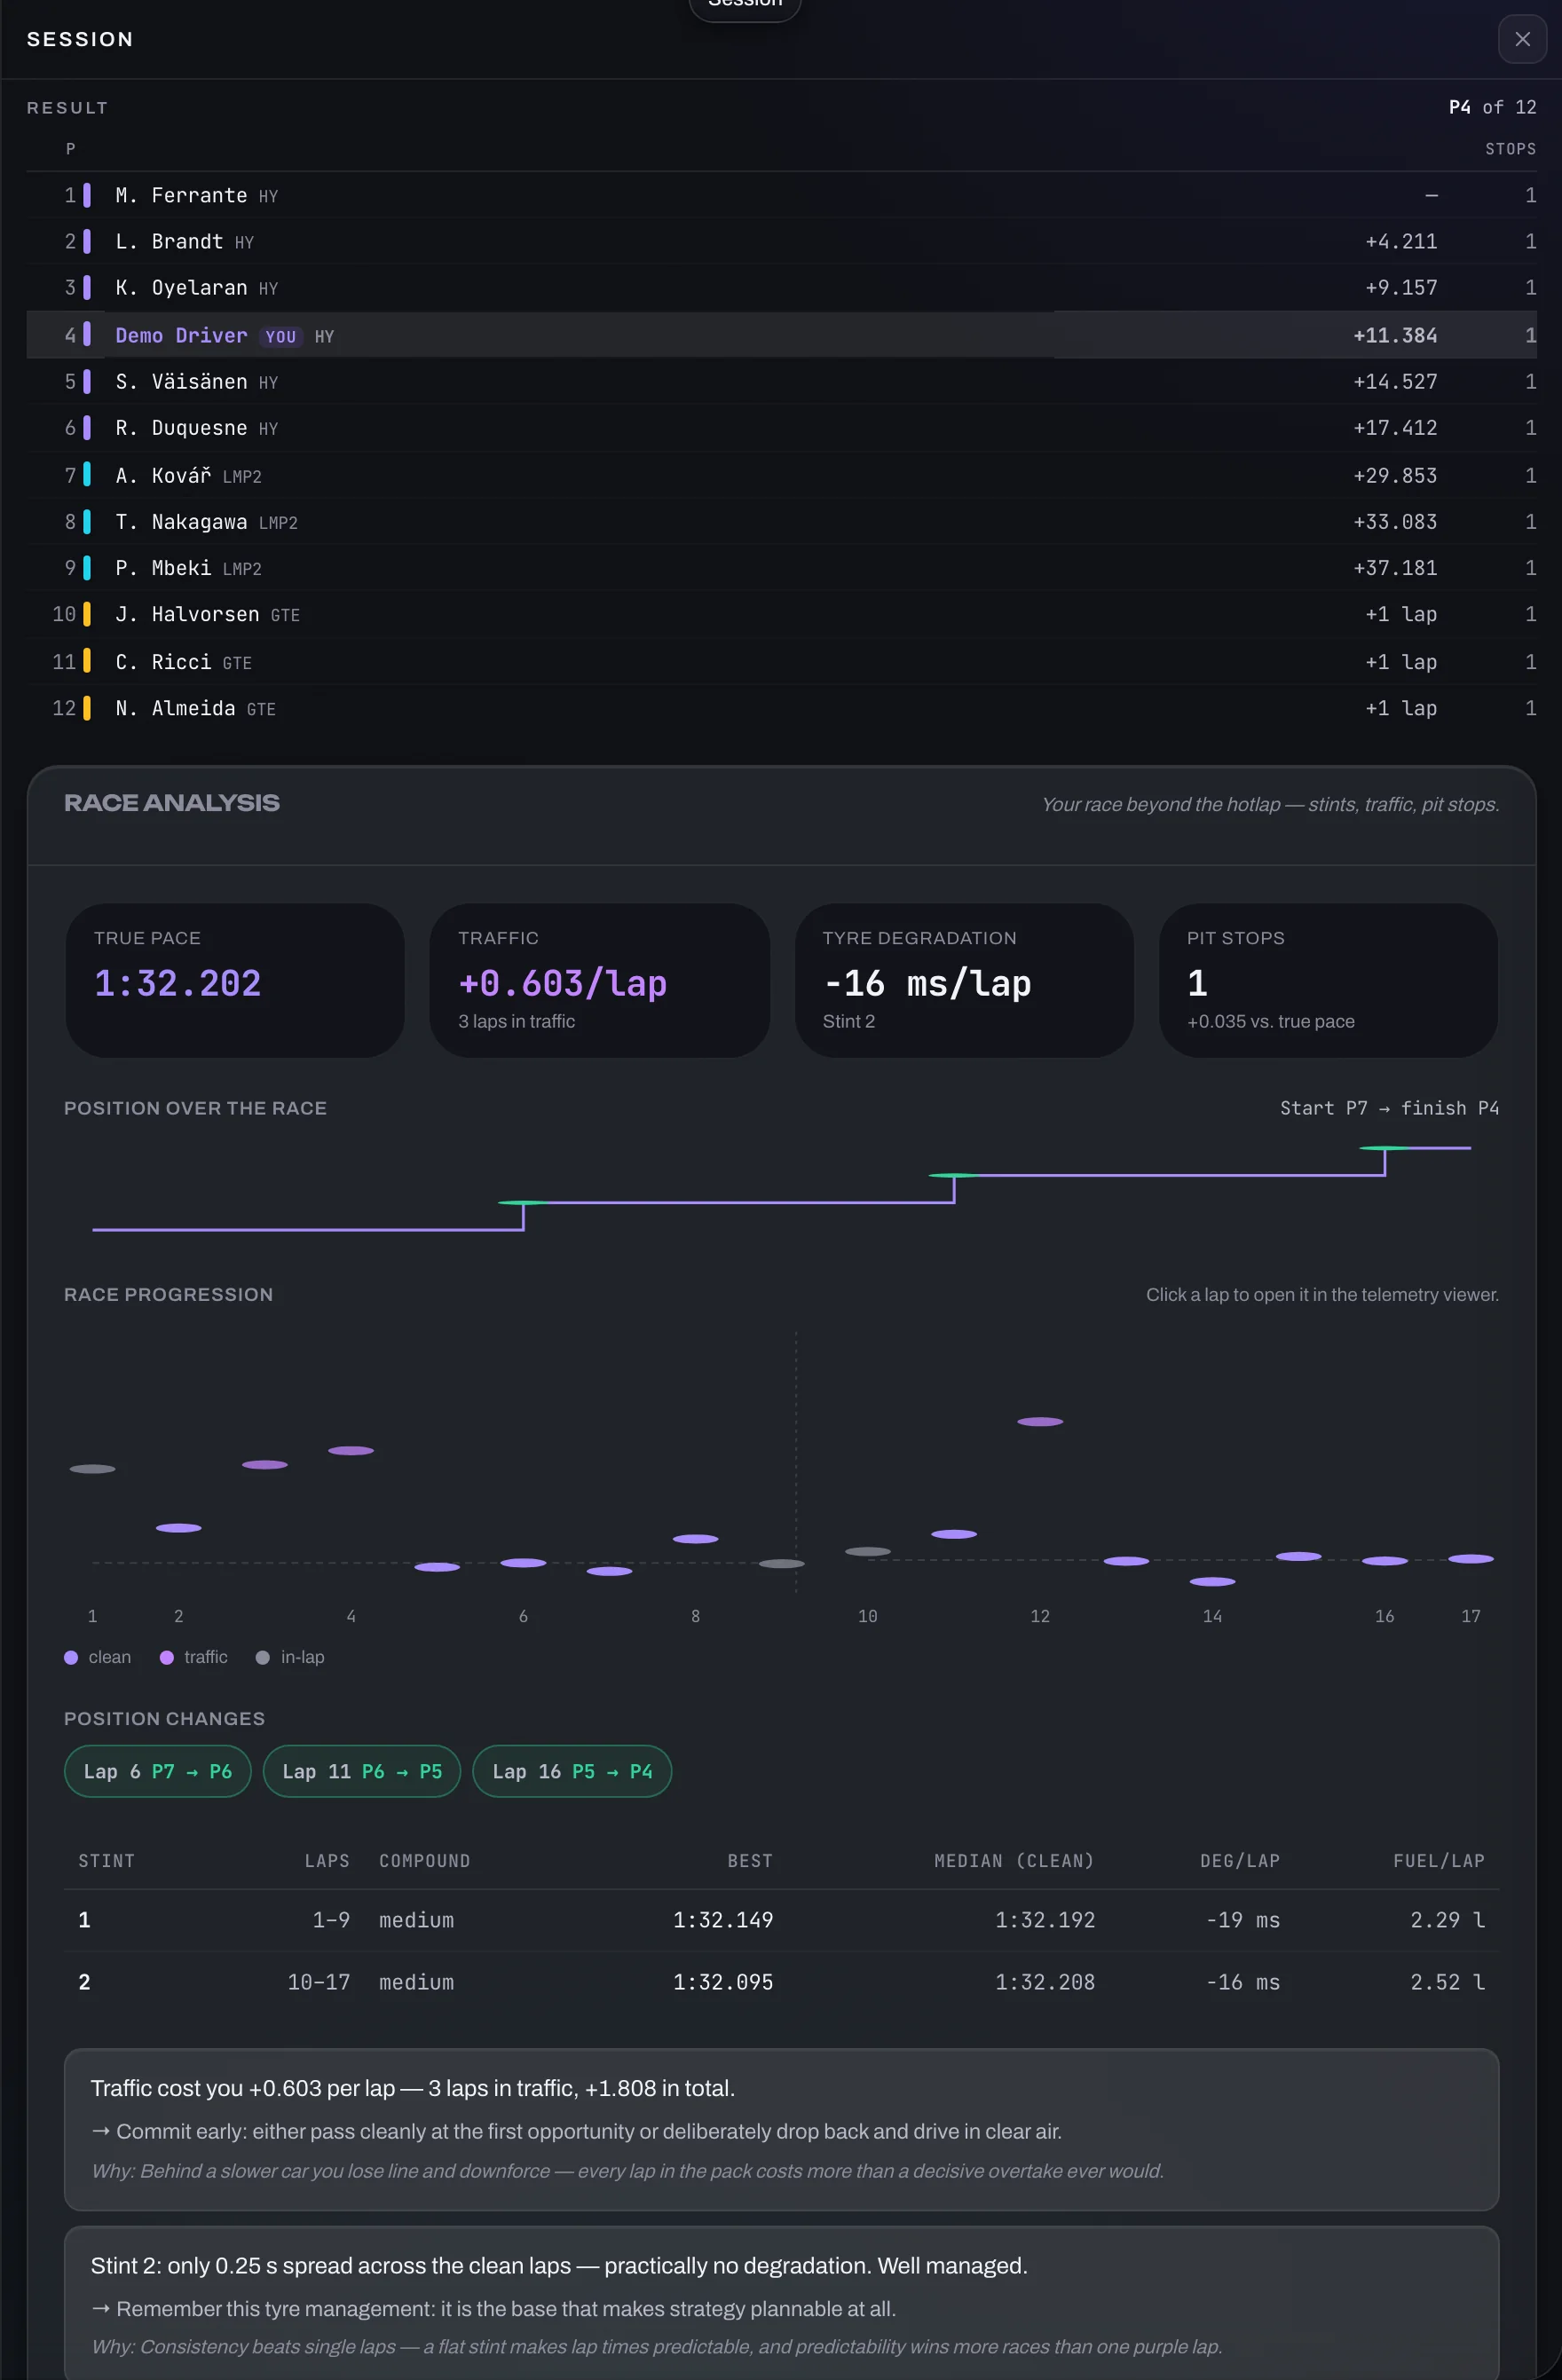
A race is not a string of hotlaps. The race analysis separates what you drove from what happened to you: stints, degradation, fuel use, time lost in traffic, the pit balance and the position graph with the laps in which it changed.
True pace
The median of your clean laps — without the opening lap, without pit entry and exit, without the laps spent behind somebody. Exactly the number a race simulation needs.
What traffic cost
Laps with a car within range are recognised as such and set against the clean median. “The race was a slog” turns into a number of seconds with the laps named.
Stints and degradation
Per stint: length, tyre compound, best and median clean lap time, the slope across the stint and consumption per lap. Below four clean laps the slope stays empty — a straight line through two points is reading tea leaves.
Final classification
Position, class, gap, last and best lap, stops and tyre age for the whole field. Le Mans Ultimate transmits the classification; the other games do not hand it over.
Who you measure against is your call.
Your own best time, any other lap from the same session or a community reference at 4 levels: P50, P75, P90, P99. Plus individual community laps as an extra trace or as the reference lap — and up to four of your own laps on top of each other at the same time.
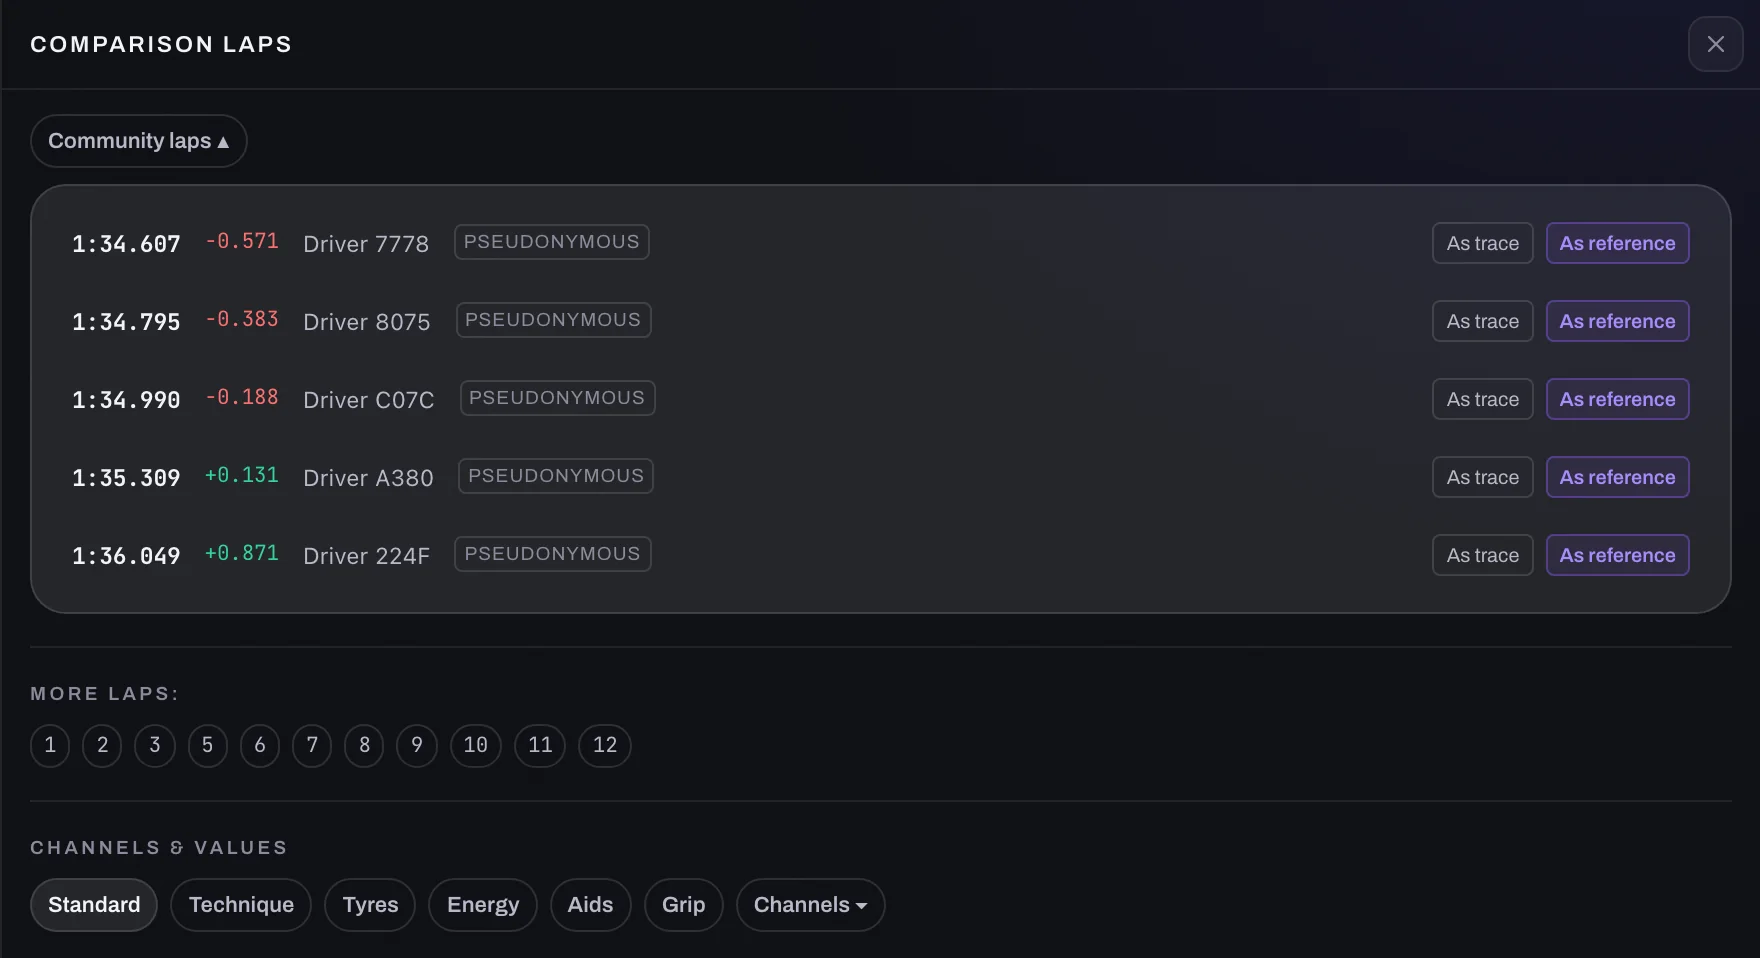
What a reference is built from
Out of real laps by real drivers, not out of a model calculation. A combination of game, car and track needs enough different drivers and enough counted laps, otherwise no reference is built. How many drivers and laps are behind it is stated on the reference.
Pseudonymous, not by name
Other people's laps appear under a handle, not under a name. Anyone who makes their profile public decides that for themselves — and anonymous laps only become visible once enough drivers have contributed to the combination.
And when there is none
Then the comparison falls back on your own best time and says so. An invented reference would be worse than none.
The community comparison is part of Pro. Comparing against your own laps — best time, session best, any other lap — is included in every plan.
What your game gives you.
Core channels, track, time loss, corner analysis and coach work the same everywhere. Everything that comes out of the 5 Hz extra matrix hangs on what the game hands over at all — here it is, line by line.
| Capability | ACC | LMU | EVO | AC |
|---|---|---|---|---|
| Plottable channels | 51 | 61 | 45 | 26 |
| Tyre temperature and pressure | complete | complete | complete | partial |
| Optimal tyre window | partial | complete | partial | not provided |
| Brake temperature | complete | complete | complete | not provided |
| Brake pad thickness | complete | not provided | not provided | not provided |
| ABS and TC engagement time | complete | complete | complete | not provided |
| Traction circle (g-forces) | complete | complete | complete | complete |
| Measured track offset | not provided | complete | not provided | not provided |
| Traffic per lap | complete | complete | complete | not provided |
| Rain and track grip | complete | complete | not provided | not provided |
| Virtual Energy and recuperation | not provided | complete | not provided | not provided |
| Final classification | not provided | complete | not provided | not provided |
| Setup sheet | not provided | complete | not provided | not provided |
iRacing is missing from this table on purpose: it is not offered at the moment. And on the Free plan exactly one game is active at a time — the first one you upload data from; further games can be unlocked individually or are included in Pro.
What the workspace does not do.
- The track is flat. No game delivers an elevation profile; the 3D view shows the layout, not the elevation.
- No map, no corner analysis. The track map is built from a clean lap. Until it has been learned for your game there are no corners, no time loss on the racing line and no coach report — the lap times and sectors are there regardless.
- Time loss needs a reference lap. The default layer draws nothing as long as there is nothing to compare against.
- Colour scales belong to the lap. Apart from throttle and brake, every scale is computed from the lap being shown. Comparing colour between two laps leads you astray.
- The track offset is only measured in Le Mans Ultimate. In the other games it is a comparison of two laps.
- Classification and setup sheet only exist where the game reports them — today Le Mans Ultimate.
- On the Free plan telemetry is deleted after 14 days. Lap times, sectors and corner metrics stay forever; frames, 5 Hz channels and the position trace are gone after that. Pro keeps them indefinitely.
- The AI debrief and the coach chat are off during the beta. What is working is the deterministic analysis.
- The workspace remembers its view in the browser, not on the server — on another machine you start from the default.
- The CSV extract is an extract: the channels currently in the stack, one lap, a fixed 2000 rows.
Your next session is already data.
The desktop app records while you drive, and the workspace is open by the time you climb out of the car. No import, no file format, no step in between.